* (Click Read Full Story »»» at the bottom of the page for the charts to appear on the post)
SPX Monitoring purposes: Flat.
Monitoring purposes GOLD: Long GDX on 1/29/19 at 21.96.
Long Term Trend SPX monitor purposes: Sold long-term SPX on 10/24/19 at 3010.29=gain 1.49%; Long SPX on 10/14/19 at 2966.15.
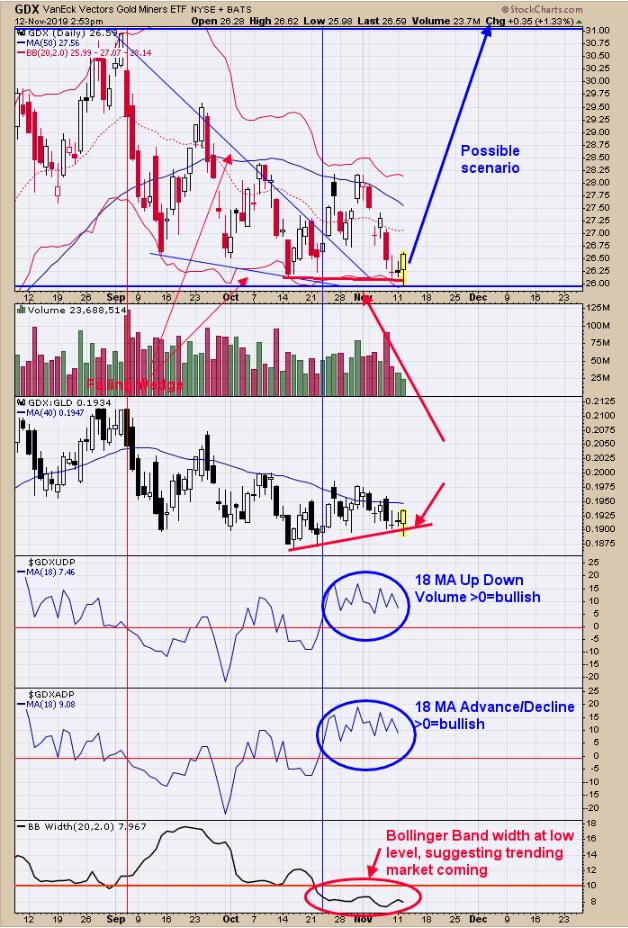
We updated this chart from yesterday. Yesterday, we said that “[t]he two important indicators on this chart are the 18 average of the GDX Up Down Volume Percent and 18 average GDX Advance/Decline percent (second and third window up from bottom). Since October 23 (GDX close 26.81) the 18 moving averages of GDX Up Down Volume and Advance/Decline have been staying above '0' which have been bullish for GDX in the past. GDX has tested the mid October lows but both indicators remain bullish with readings above '0'. The bottom window is the Bollinger Bandwidth which has stayed below '10' for an extended time, suggesting market is not far from an impulse wave. Middle window is the GDX/GLD ratio. This ratio is making higher lows while GDX has made lower lows, showing that GDX/GLD ratio is stronger than GDX and a bullish sign.” With these bullish indicators, it appears that GDX impulse wave could start at any time. Long GDX on 1/29/19 at 21.97.
 News
News  Market Data
  Discover