SPX Monitoring purposes; Sold long SPX 6/7/19 at 2873.33= gain 4.41%; long 5/31/19 & 2752.06. Monitoring purposes gold: Long VanEck Vectors Gold Miners ETF (NYSE:GDX) on 1/29/19 at 21.96. Long-erm Trend SPX monitor purposes; Sold long SPX on 5/6/19 at 2932.61= gain 5.96%:
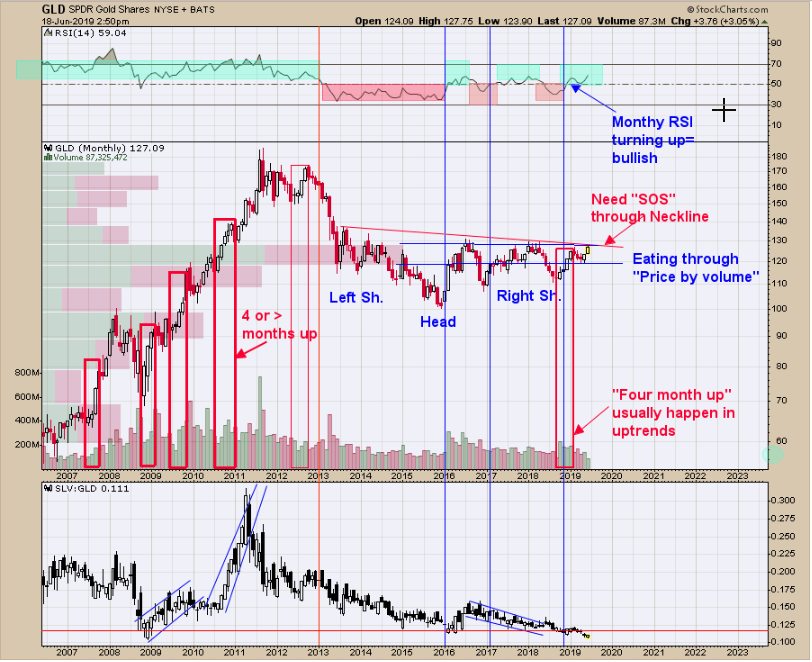
Above is the monthly Gold market going back to late 2006. On the left side of the chart above is the “price by Volume” indicator which shows what prices has the most volume (going back to late 2006) which in the case for GLD (NYSE:GLD) is from 120 to 130 levels. Once above the 130 level, GLD should find support near 130 (current close is 127.09). Gld appears to be drawing a Head and Shoulders bottom pattern. This potential Head and Shoulders pattern has the Neckline around the 130 which is where the top of the “Price by Volume” levels lies. For a confirmed break of this area a “Sign of Strength” (SOS) is needed which may come sooner rather then later. I might add there could be a “False Whipsaw” to get weak hands to fold before this strong move up gets underway. We have red boxes put where GLD was up four months in a row which happens in up-trends. The most recent four months up came from October 2018 to January 2018 giving support for an uptrend in GLD. The top window is the monthly RSI for GLD. A market is considered in an uptrend when RSI is above 50. The current timeframe on this chart is the monthlies and the RSI is above 50 suggesting a longer term move is in progress. GLD is setting at a price (130 neckline and Price by Volume level) where volatility should increase (where whipsaw first before SOS or just SOS). Look for price volatility to increase in the coming weeks. In bull market Gold stocks outperform gold and therefore GDX should outperform gold. Long GDX on 1/29/19 at 21.97.
 News
News  Market Data
  Discover