Weekly Wrap Crude Oil (USO) »» Daily & Weekly Charts By: Carl Swenlin | June 7, 2019
IT Trend Model: NEUTRAL as of 5/30/2019
LT Trend Model: SELL as of 6/4/2019
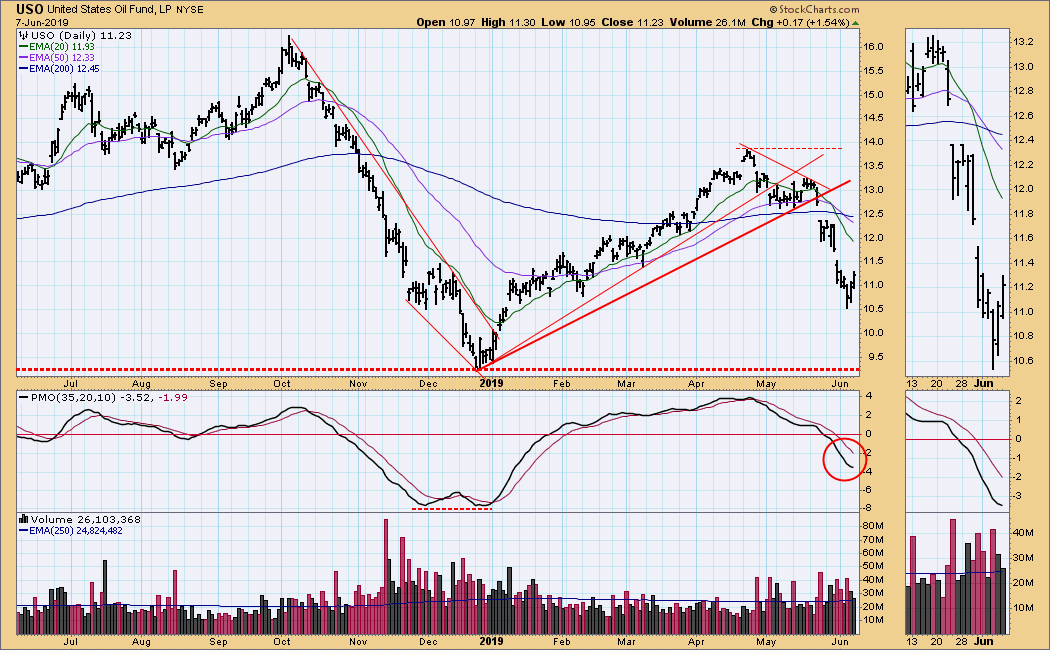
USO Daily Chart: On Tuesday the USO 50EMA crossed down through the 200EMA causing the LT Trend Model to change from BUY to SELL.
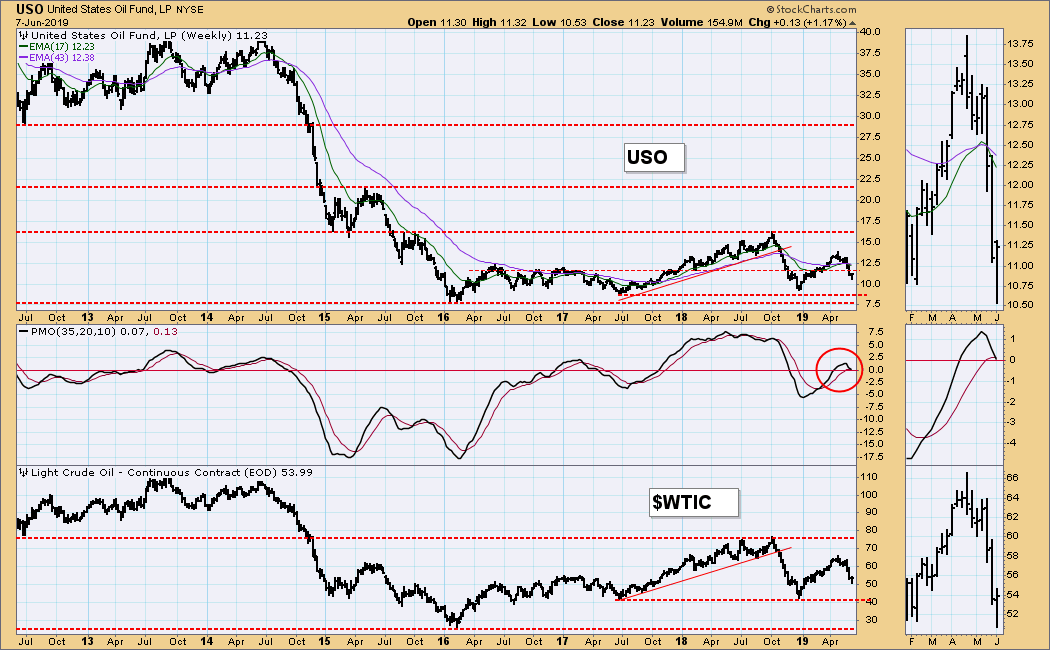
USO Weekly Chart: In spite of a deep dive this week, USO managed to close up; however, the weekly PMO crossed down through the signal line. Notice that WTIC is in the lower half of its trading range, and a decline to about $42 is not out of the question.
 News
News  Market Data
  Discover