


| Followers | 689 |
| Posts | 143817 |
| Boards Moderated | 35 |
| Alias Born | 03/10/2004 |
Saturday, June 01, 2019 9:30:51 AM
By: Carl Swenlin | May 31, 2019
IT Trend Model: NEUTRAL as of 5/30/2019
LT Trend Model: BUY as of 4/17/2019
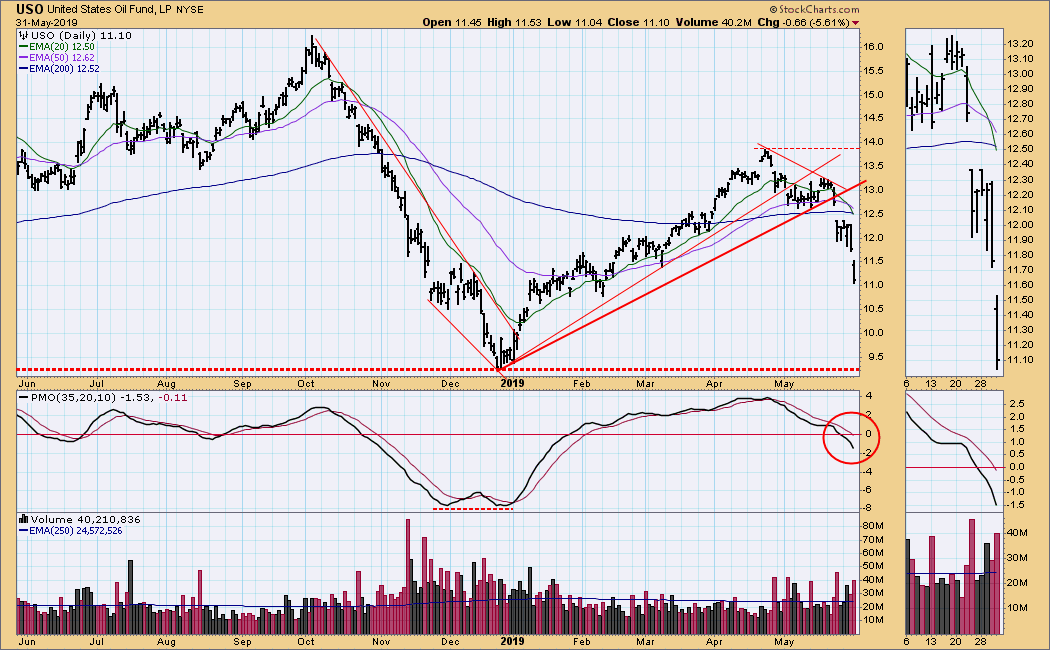
USO Daily Chart: On Thursday the USO 20EMA dropped below the 50EMA, causing the IT Trend Model to change from BUY to NEUTRAL. USO has declined about -18% from the April top, and the most obvious support is at the December low, which is the equivalent to about $42/bbl for crude.
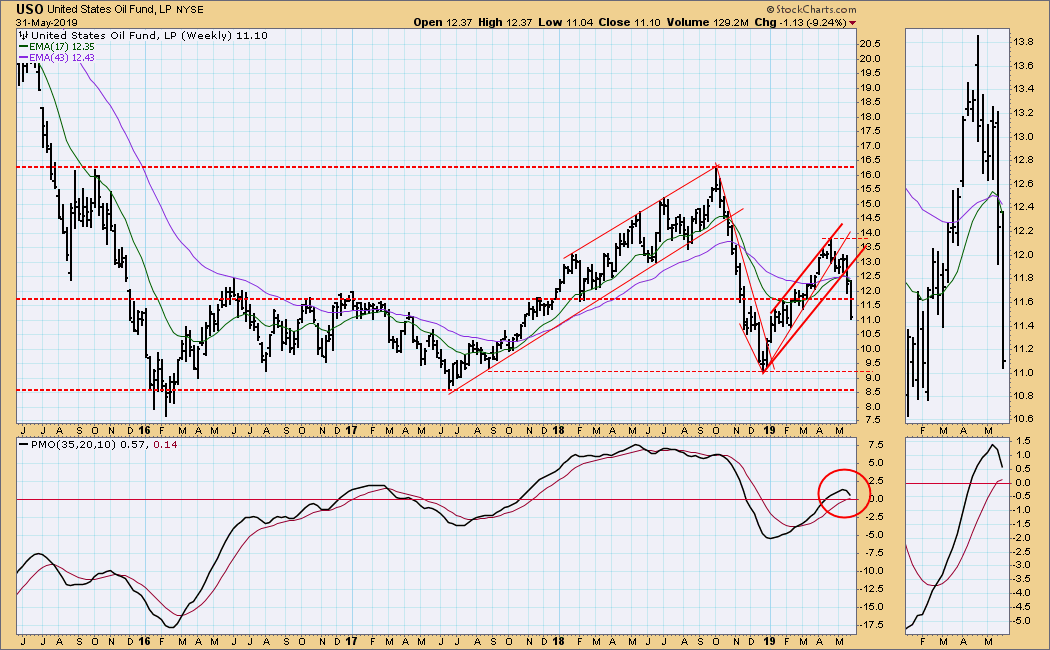
USO Weekly Chart: USO has hit an area of support, but I think it is still likely to fall toward the support at 8.50. The weekly PMO has topped and adds weight to my downside expectations.
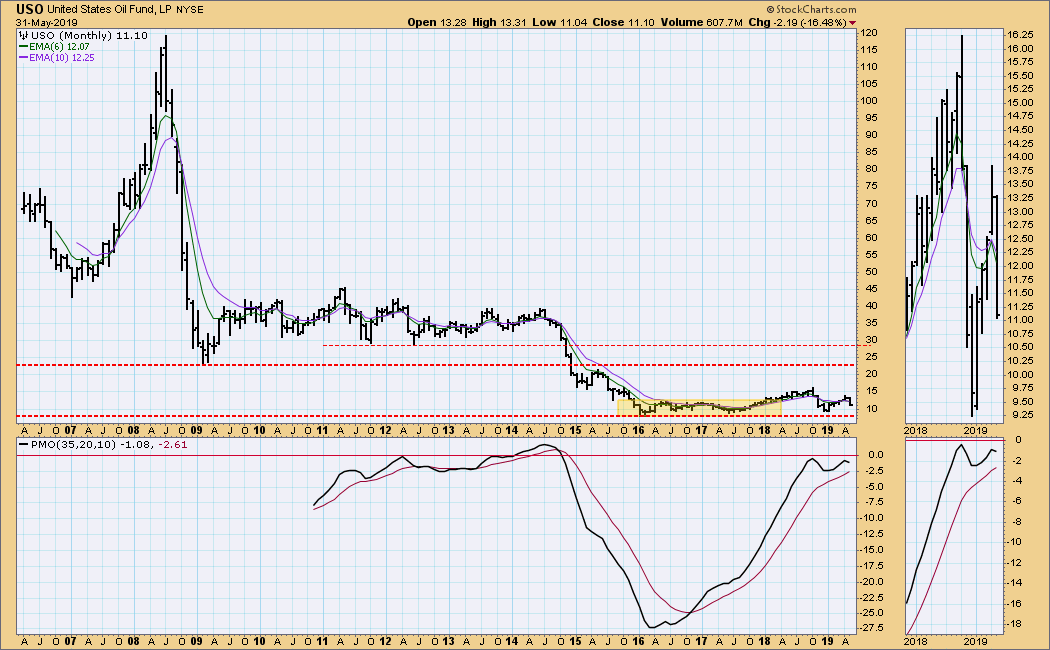
USO Monthly Chart: This is a good example of how the PMO responds to price movement. USO took a dive in 2015, and the PMO became very oversold. USO has been moving sideways for over three years, and during that time the PMO has moved back to the zero line, indicating no internal pressure to move either way. I expect it to remain within the trading range for some time.
Read Full Story »»»
• DiscoverGold
Click on "In reply to", for Authors past commentaries
Information posted to this board is not meant to suggest any specific action, but to point out the technical signs that can help our readers make their own specific decisions. Your Due Dilegence is a must!
• DiscoverGold
FEATURED Cannabix Technologies and Omega Laboratories Inc. Advance Marijuana Breathalyzer Technology - Dr. Bruce Goldberger to Present at Society of Forensic Toxicologists Conference • Sep 24, 2024 8:50 AM
FEATURED Integrated Ventures, Inc Announces Strategic Partnership For GLP-1 (Semaglutide) Procurement Through MedWell USA, LLC. • Sep 24, 2024 8:45 AM
Avant Technologies Accelerates Creation of AI-Powered Platform to Revolutionize Patient Care • AVAI • Sep 24, 2024 8:00 AM
VHAI - Vocodia Partners with Leading Political Super PACs to Revolutionize Fundraising Efforts • VHAI • Sep 19, 2024 11:48 AM
Dear Cashmere Group Holding Co. AKA Swifty Global Signs Binding Letter of Intent to be Acquired by Signing Day Sports • DRCR • Sep 19, 2024 10:26 AM
HealthLynked Launches Virtual Urgent Care Through Partnership with Lyric Health. • HLYK • Sep 19, 2024 8:00 AM

