Weekly Wrap Crude Oil (USO) »» Daily & Weekly Charts By: Carl Swenlin | April 12, 2019
IT Trend Model: BUY as of 2/19/2019
LT Trend Model: SELL as of 11/23/2018
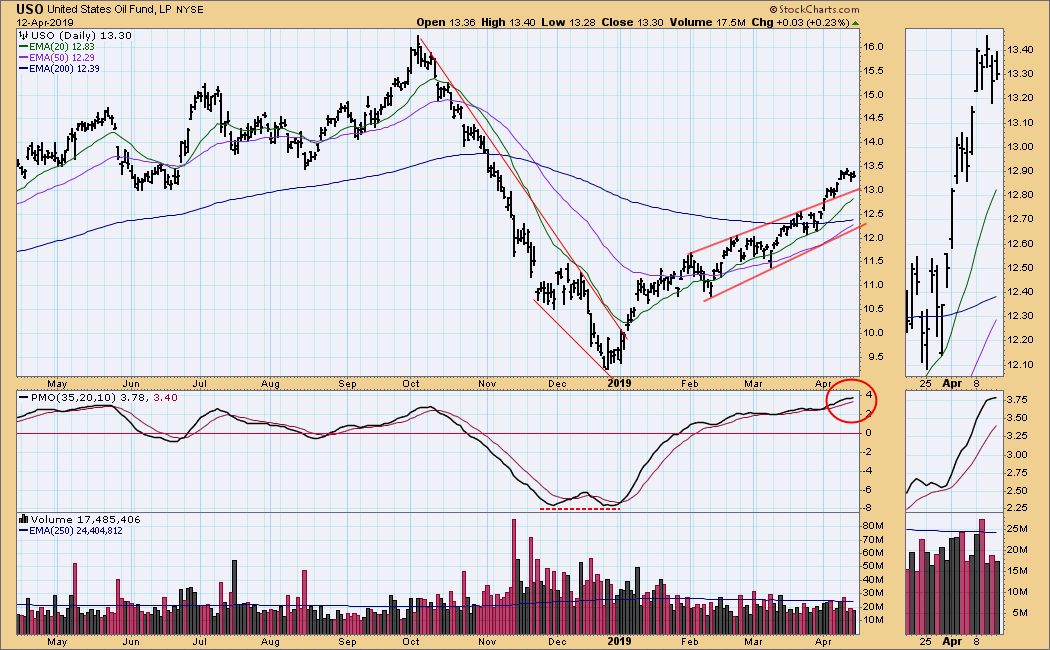
USO Daily Chart: On Monday USO continued last week's breakout, then it entered a holding pattern the rest of the week. The daily PMO is at the top of a long-term range and is very overbought.
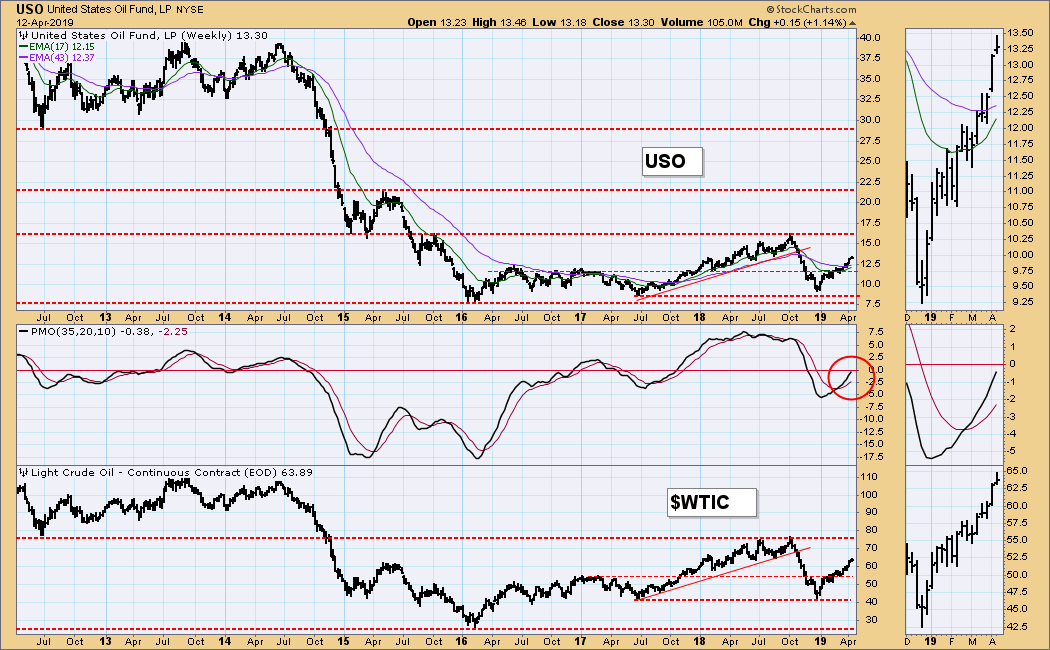
USO Weekly Chart: I still think that last year's high of 76 will be the upside limit of the current rally.
 News
News  Market Data
  Discover