Weekly Wrap Crude Oil (USO) »» Daily & Weekly Charts By: Carl Swenlin | April 19, 2019
IT Trend Model: BUY as of 2/19/2019
LT Trend Model: BUY as of 4/17/2019
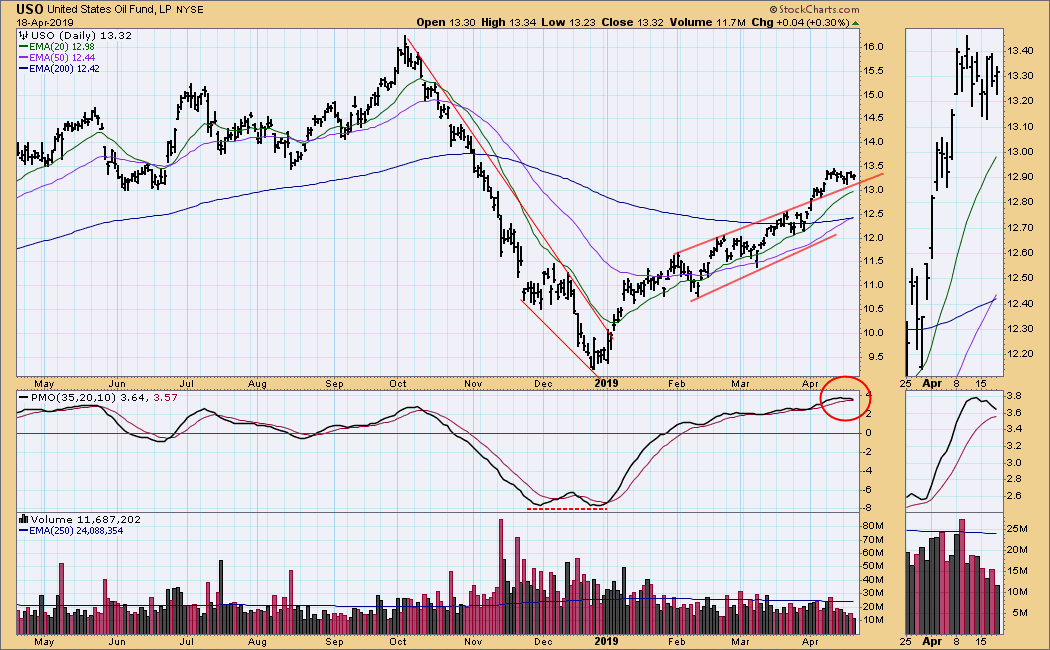
USO Daily Chart: On Thursday the 50EMA crossed up through the 200EMA, generating an LT Trend Model BUY signal, but the daily PMO topped last week, and I wonder how durable that new signal will prove to be.
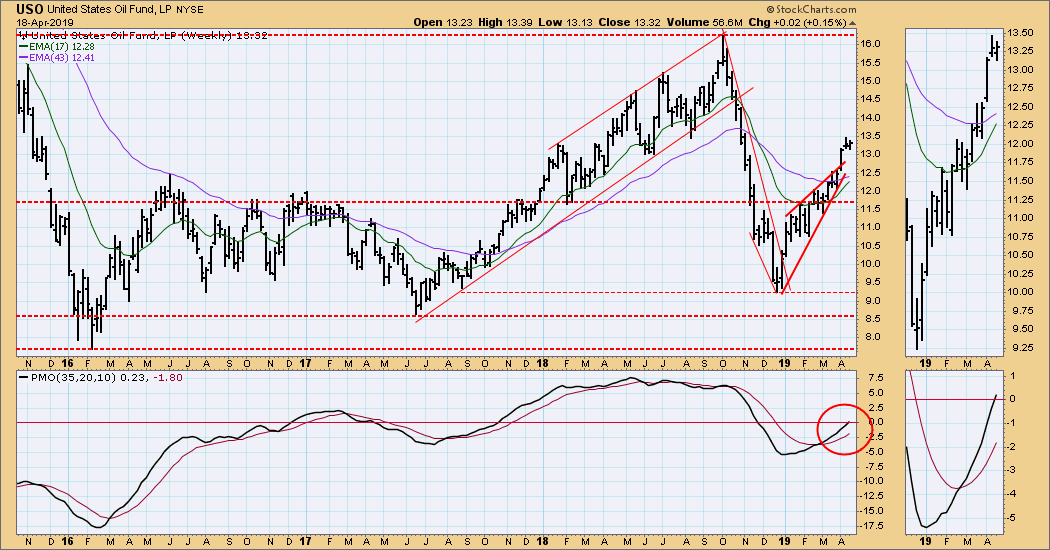
USO Weekly Chart: The tight and bearish rising wedge resolved upward, which is bullish. The weekly PMO has mover up through the zero line -- also bullish. The upside target is last year's high, which is about $76/bbl for crude.
 News
News  Market Data
  Discover