Weekly Wrap (Gold) »» Daily, Weekly & Monthly Charts By: Carl Swenlin | February 1, 2019
IT Trend Model: BUY as of 10/19/2018
LT Trend Model: BUY as of 1/8/2019
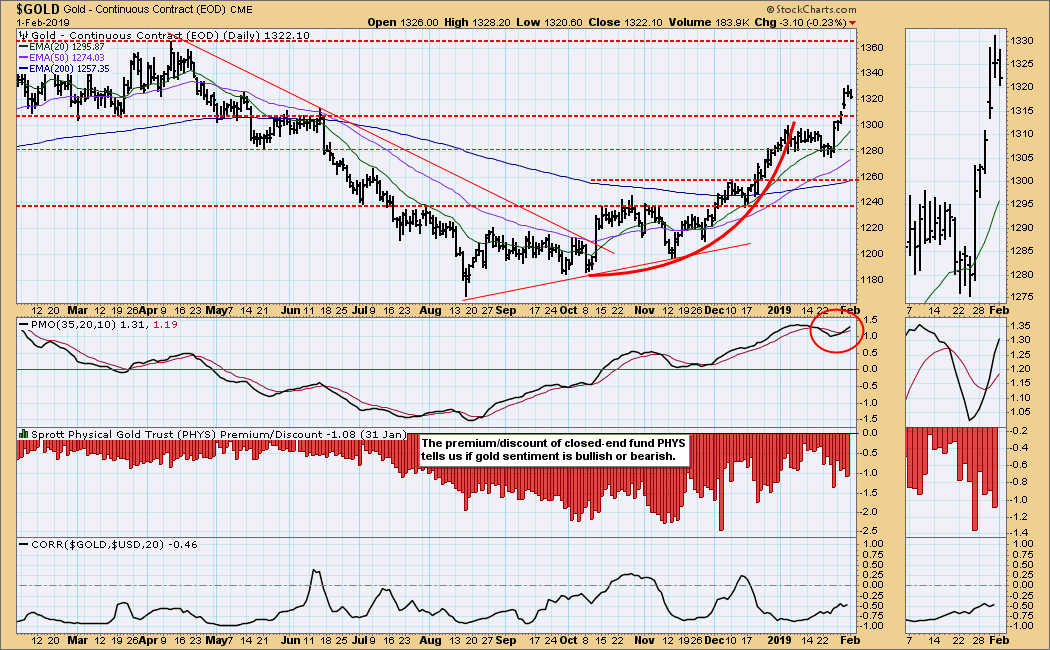
GOLD Daily Chart: Gold is looking very positive. It had a significant breakout this week, and the daily PMO is above the signal line and rising.
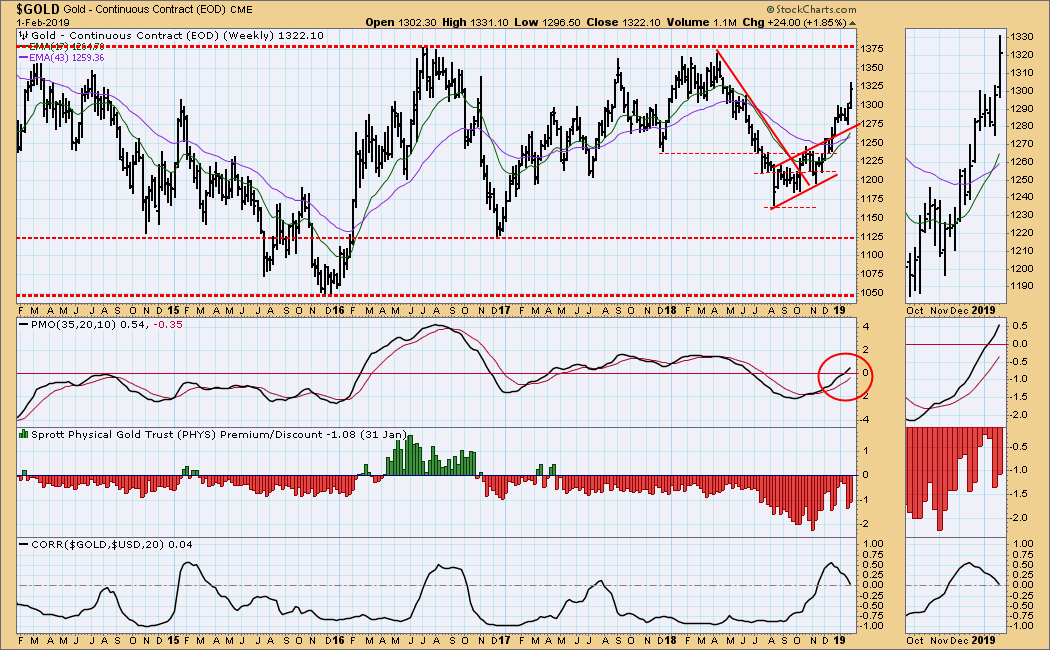
GOLD Weekly Chart: The weekly PMO is rising and is above the signal line and zero line.
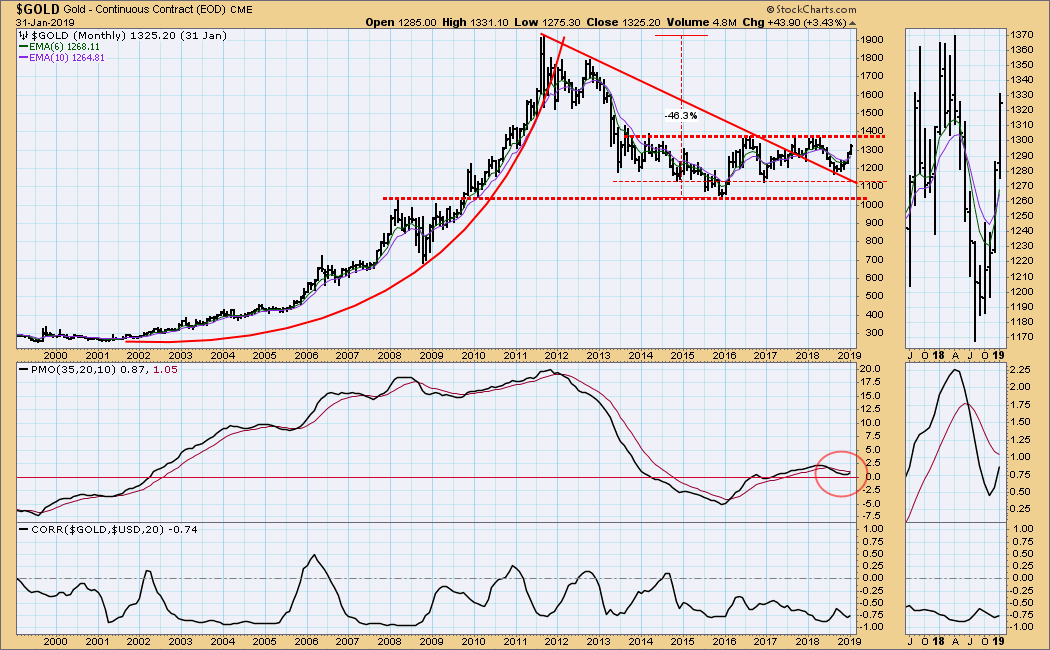
GOLD Monthly Chart: The monthly PMO is above the zero line and rising. It appears that price could be testing the top of the five-year trading range in a month or two. For clarity, monthly charts in this issue are dated as of 1/31/19 (Thursday).
 News
News  Market Data
  Discover