The DJIA only achieved its MINIMUM downside objective on Friday, i.e., a 38.2% retrace of the 2016-2018 rally.
Dec 21
The Bullish Percent Indexes for the NDX100 and SP500 are at their lowest levels since 2009. The BPI for the DJIA is at its lowest since 2015. All are considered bad oversold readings.
Dec 19
I'm thinking c of A.
Walter Murphy added,----- The market met your 38.2% Fib retracement of 2016-2018. Is this the c of THE abc? What happens next?
Dec 19
Two weeks ago I expressed concern that even as Elliott Wave suggested a downside acceleration for the DJIA, its BPI was meaningfully o/b at 86.67%. Today, the BPI is 26.67%.
Dec 10
One of the things we have been concerned about is the o/b condition of DJIA's BPI.
Today it fell 23 points -- the largest 1 day drop since 8/2015
Dec 7
Almost exactly half (748) of the stocks in the broad S&P 1500 are at least 20% below their 52-week high
Dec 7
The weekly Coppock Curve has a bearish bias for 9 of 11 S&P sectors -- including tech, financials, and healthcare (48.4% of the S&P 500).
Dec 7
The weekly Coppock Curve has a bearish bias for 26 of the 30 DJIA stocks
Dec 7
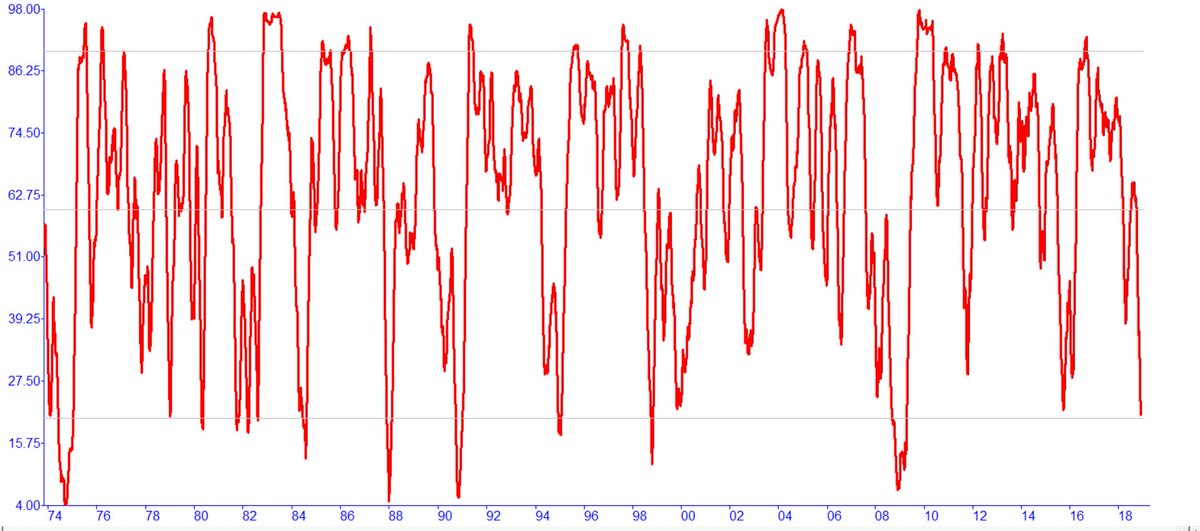
The late Marty Zweig is well known for his breadth thrust indicator. Less well known is his high-low index measuring the 60-day ma of the ratio of NYSE 52-wk highs to 52-week lows. The attached chart shows that his index is now on a par with previous cyclical lows since 1974.
Dec 4
To add salt to the wound, the Bullish Percent Index for the DJIA is at a meaningfully o/b reading of 86.67% even as there is an Elliott Wave count suggesting the potential for a downside acceleration.
Dec 4
Be careful. Today's decline is potentially the beginning of wave 3 of C from the early October top. That is the equivalent of a powerful third-of-a-third.
Nov 27
For those keeping score, the Case-Shiller home price a-d line has not had a down month since Jan 2015
Nov 25
The S&P 500's intermediate weekly Coppock Curve is at a 20-month low.
Nov 25
The weekly (intermediate) Coppock Curve still has a bearish bias for 24 of the 30 DJIA stocks,
Nov 16
NYSE: 11th straight week with more 52-week new lows than new highs. Longest streak since Jun-Oct 2015 & 2nd longest streak since 2009.
======================
daily chart of :
the cumulative net new 52-week highs minus 52-week lows for four indices and with $SPX daily price closes -
/ES 2712.25 / 2690.00 levels must eventually be surpassed on a lasting basis, OR the bears continue to rule the day for many months or years to come ...
/ES 2548 region is the next level below, which the bulls must permanently surpass with future price bounces to gain upside traction having probable staying power
pullback lows by /ES S&P 500 futures of interest since June 2018:
2340.50 - December 24 near the cash market close, half-day session 2409.25 - December 21 very late day 2441.50 - mid day 2476.25 - December 20 morning globex session 2489.50 - December 19 day session 2531.00 - December 18 late day 2533.xx - December 17 late day
* the sharp decline lower started after October 5 and continued into October 26, 2018, followed by a brief pause
2712.25 - in week ended October 12 2873.25 - October 5 late day 2887.75 - October 4 mid-day 2865.00 - September 7 a.m. 2877.50 - September 5 2885.50 - September 4 2891.75 - August 31 2876.75 - low in week ended August 31 2850.00 2831.00's 2803.00 2791 August low 2790 late July low 2788 to 2767 = the often tested horizontal support zone in June to July 2018
/ES futures chart - weekly
SPY weekly with 50,2 -- 21,2 -- 15,2 Bollinger Bands
* will the 100-week simple moving average act as future resistance during bounces?
* for a starting initiation to any future bounce having possible staying power, the week needs to close the Friday price action above the SPY 4-week simple moving average
 News
News  Market Data
  Discover