CoT: Peek Into Future Through Futures, How Hedge Funds Are Positioned By: Hedgopia | July 21, 2018
Following futures positions of non-commercials are as of July 17, 2018.
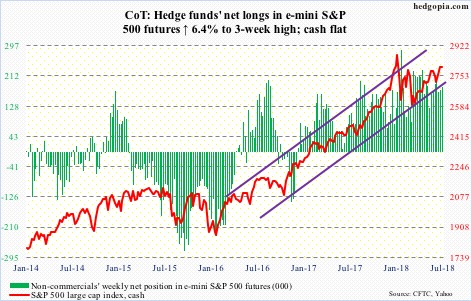
E-mini S&P 500:Currently net long 183k, up 11k.
The cash (2801.83) peaked on January 26 at 2872.87, followed by a sharp drop into a reversal low on February 9. Since then, it traded within a rectangle. Shortly thereafter, a rising channel developed. The S&P 500 this week feebly broke out of the rectangle at 2800, but the upper bound of the channel would not be tested until 2840. Wednesday, it rose as high as 2816.76.
The daily chart is way overbought. Odds are bulls will have difficulty defending the rectangle breakout. The 50-day rests at 2751.32.
In the meantime, after losing $45.4 billion in six weeks of outflows, US-based equity funds (including ETFs) in the week through Wednesday gained $1.1 billion (courtesy of Lipper.com). In the same week, SPY (SPDR S&P 500 ETF) took in $369 million, IVV (iShares core S&P 500 ETF) $54 million and VOO (Vanguard S&P 500 ETF) $201 million (courtesy of ETF.com). The S&P 500 was flat this week, with a doji.
For what it is worth, foreigners continue to reduce exposure to US stocks.
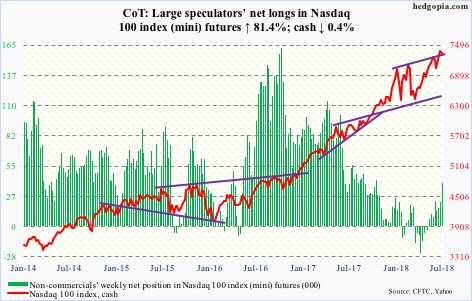
Nasdaq 100 index (mini):Currently net long 39.2k, up 17.6k.
The cash (7350.23) made yet another high Tuesday (7418.43), once again kissing the upper bound of an ascending channel from January. Flows were in full cooperation.
In the week ended Wednesday, QQQ (PowerShares QQQ ETF) attracted $1.7 billion (courtesy of ETF.com). This followed $568 million in outflows in the prior three weeks. For the week, however, the Nasdaq 100 fell 0.4 percent. The daily chart is extremely overbought. The path of least resistance is down – at least near term.
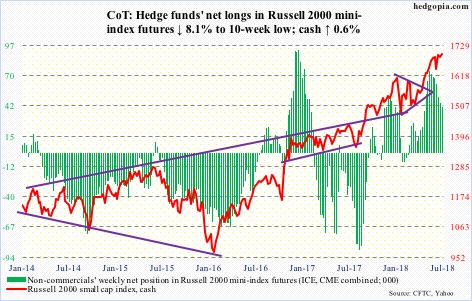
Russell 2000 mini-index:Currently net long 41.1k, down 3.6k.
Last week, the cash (1696.81) rose to a new intraday high of 1708.56, but that hardly surpassed the prior high of 1708.10 from June 20. Bulls are not giving up that easy, though. They defended the 20-day late last week and this week. For what it is worth, on the daily chart a one-month cup-and-handle is forming. Should the pattern complete, the Russell 2000 likely gets another tailwind.
At least until Wednesday, this was not a scenario being bet on. In the week ended that session, IWM (iShares Russell 2000 ETF) lost $536 million and IJR (iShares core S&P small-cap ETF) $55 million (courtesy of ETF.com).
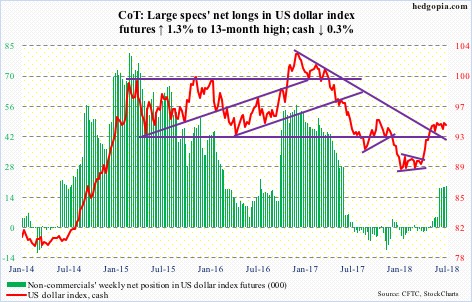
US Dollar Index:Currently net long 18.9k, up 239.
Dollar bulls launched one more assault on 95-plus, and yet again they were denied. The cash (94.23) faced resistance at that level for a whole month before retreating from an intraday high of 95.25 on June 28. Thursday, the US dollar index rallied all the way to 95.44 intraday, only to close at 94.94, in the end producing a candle with a long wick. Friday, it dropped 0.8 percent. The 50-day (94.03) is a hair’s breadth away. Odds favor it will be lost.
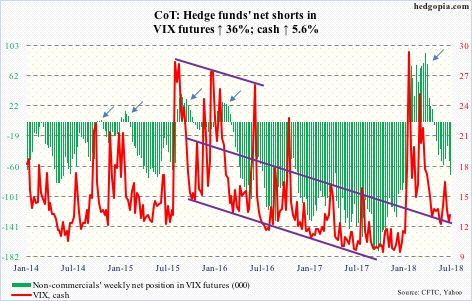
VIX:Currently net short 71.8k, up 19k.
In the last nine sessions, volatility bears succeeded in pushing the cash (12.86) sub-12 intraday five times, including Tuesday and Wednesday this week, but not sub-11. This support has held for the past six weeks, and likely will continue to do so. The daily chart is itching to move higher.
Interestingly, the 21-day moving average of the CBOE equity-only put-to-call ratio closed the week at 0.615. Earlier on June 26, the ratio dropped to 0.56, which reflects elevated investor optimism. This needs to unwind, which is yet to occur in earnest. But there is time. The ratio can rise to high-0.60s/low-0.70s, which is where investor sentiment often tends to bottom.
 News
News  Market Data
  Discover