


| Followers | 689 |
| Posts | 143817 |
| Boards Moderated | 35 |
| Alias Born | 03/10/2004 |
Saturday, July 14, 2018 9:58:35 AM
CoT: Peek Into Future Through Futures, How Hedge Funds Are Positioned
By: Hedgopia | July 14, 2018
Following futures positions of non-commercials are as of July 10, 2018.
E-mini S&P 500: Currently net long 172k, up 4k.
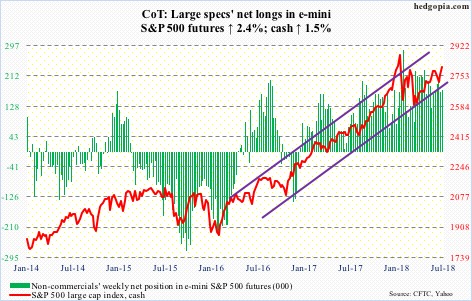
For the sixth straight week through Wednesday, money came out of US-based equity funds (including ETFs), with the latest week losing $1.8 billion. In the prior five, $43.6 billion was withdrawn (courtesy of Lipper.com).
In the same week, SPY (SPDR S&P 500 ETF) lost $558 million and IVV (iShares core S&P 500 ETF) $218 million. VOO (Vanguard S&P 500 ETF) gained $72 million (courtesy of ETF.com).
Despite these outflows, the cash (2801.31) continued to attract bids in a low-volume push higher. It is currently sitting right on resistance at 2800. The daily chart is overbought; 2Q earnings can dictate action near term.
Nasdaq 100 index (mini): Currently net long 21.6k, up 5.5k.
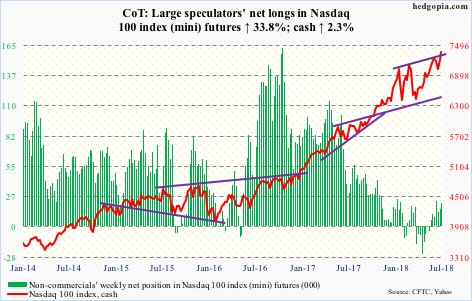
Price continues to diverge from the internals. The cash (7375.82) in a doji session Friday rallied to yet another new high (7387.74). Generals are driving all the action. Soldiers are falling behind. On June 14, 85 percent of Nasdaq 100 stocks were above their 50-day. Now, it is merely 76 percent.
Concurrently, QQQ (PowerShares QQQ ETF) in the week ended Wednesday lost another $29 million (courtesy of ETF.com). This was the third straight week of outflows (five in last six).
Be that as it may, price is telling us otherwise. Once again, the Nasdaq 100 is approaching the upper bound of an ascending channel from January. When a similar test took place on June 20, the index retreated before finding support at the 50-day.
Russell 2000 mini-index: Currently net long 44.8k, down 6k.
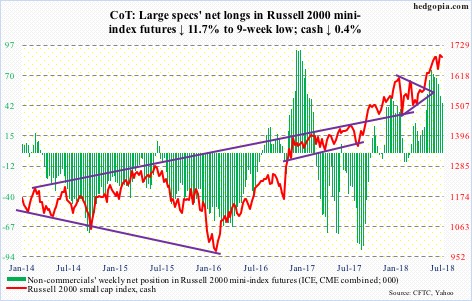
For a change, there was no breakout on the cash (1687.08). Tuesday’s intraday high of 1708.56 slightly exceeded the prior high of 1708.10 from June 20 before coming under slight pressure. Not much damage was done as buyers showed up at the 20-day. But small-caps massively lagged this week, down 0.4 percent.
In the week to Wednesday, IWM (iShares Russell 2000 ETF) lost $262 million, while IJR (iShares core S&P small-cap ETF) took in $257 million (courtesy of ETF.com).
The relative underperformance by small-caps, should it continue, can be a tell considering they were a favorite go-to sector for weeks until they seemingly hit the wall four weeks ago.
US Dollar Index: Currently net long 18.7k, up 13.

The daily lower Bollinger band on the cash (94.50) was defended Monday. As was the 50-day for a few sessions. The upper BB lies at 95.11. The weekly chart is way overbought, but the daily chart has room to once again go attack resistance at 95. The US dollar index faced resistance at that level for a whole month before retreating from an intraday high of 95.25 on June 28. This approximates crucial resistance.
The index reached an intraday high of 103.82 on January 3. Between that high and an intraday low of 88.15 on February 16, it fell 15.1 percent. A 38.2-percent retracement of this decline lies at 94.14.
VIX: Currently net short 52.8k, up 19.6k.
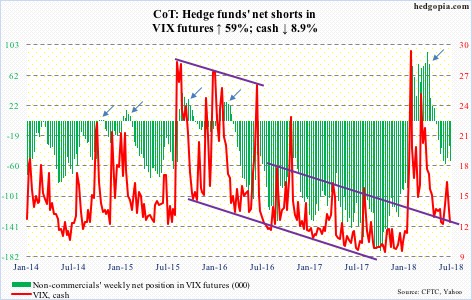
After losing the 50- and 200-day last Friday, the cash (12.18) unsuccessfully tested the averages Wednesday. Tuesday, VIX went sub-12 intraday. Ditto Friday. Both those sessions were also spinning top sessions. In all probability, VIX is getting ready to rally.
The daily lower Bollinger band lies at 10.67, which volatility bears would love to test. In ideal circumstances for them, the VIX-to-VXV ratio – at 0.838 Friday – can still nudge lower. In the past, the ratio has shown a tendency to bottom at low-0.80s/high-0.70s.
Medium term, there is a lot of optimism built into the 21-day moving average of the CBOE equity-only put-to-call ratio. It closed the week at 0.596, having earlier dropped to 0.56 on June 26. This needs to unwind. While that occurs, the ratio can rise to high-0.60s/low-0.70s, and when that unfolds equities tend to come under pressure.
https://hedgopia.com/cot-peek-into-future-through-futures-how-hedge-funds-are-positioned-61/
• DiscoverGold
Click on "In reply to", for Authors past commentaries
Information posted to this board is not meant to suggest any specific action, but to point out the technical signs that can help our readers make their own specific decisions. Your Due Dilegence is a must!
• DiscoverGold
Join the InvestorsHub Community
Register for free to join our community of investors and share your ideas. You will also get access to streaming quotes, interactive charts, trades, portfolio, live options flow and more tools.

