Nasdaq 100 Last Week Retreats From Crucial Level – Action This Week Could Be Telling By: Hedgopia | May 21, 2018
The Nasdaq 100 index/QQQ could be potentially forming the right side of a bearish head-and-shoulders pattern. This week’s action could provide further clues.
The US economy is one month short of completing nine years of expansion. The recovery has been subdued, to say the least. Real GDP has averaged growth of 2.2 percent, a full percentage point below the long-term average going all the way back to 2Q47 of 3.2 percent. This despite the fact that growth has been decent the last three quarters, with 1Q18 growing at 2.3 percent, 4Q17 at 2.9 percent, 3Q17 at 3.2 percent and 2Q17 at 3.1 percent.
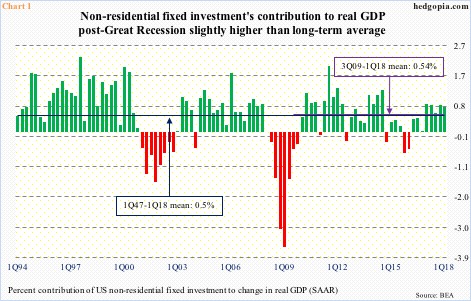
Business capex relatively is not faring that badly, but is when considered on an absolute basis. In the current recovery, non-residential fixed investment contributed an average 0.54 percent to the afore-mentioned 2.2 percent GDP growth. This compares favorably to the long-term average contribution of 0.5-percent to the average 3.2-percent growth in GDP (Chart 1).
That said, post-Great Recession, the share of non-residential fixed investment in GDP has averaged 12.3 percent, versus an average 12 percent going back to 1Q47.
Subdued capex comes with a cost.
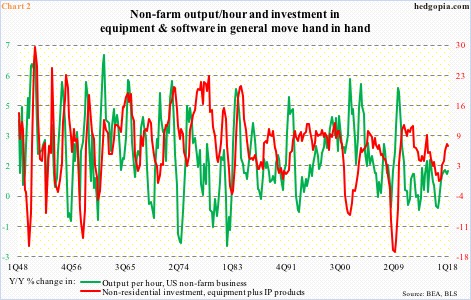
In Chart 2, non-farm output per hour is pitted against non-residential investment in equipment and intellectual property products (investment in structures is excluded). In 1Q18, the latter came in at a seasonally adjusted annual rate of $1.97 trillion ($1.16 trillion and $809.9 billion, respectively), growing 7.2 percent year-over-year.
Since 4Q16, non-residential investment in equipment and IP products has trended higher. Non-farm productivity has followed. In 1Q18, the latter rose 1.34 percent y/y. As early as 2Q16, it contracted 0.41 percent.
Despite the uptrend in recent quarters, productivity has been anemic. The last time it grew y/y with a two handle was in 3Q10.
The good thing – if it can be called that – is that low productivity has not much impacted corporate margins, raising questions about the latter’s sustainability.
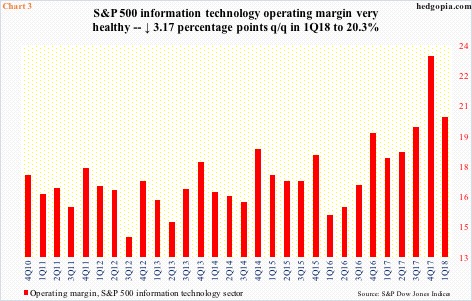
With 93 percent results in, 1Q18 operating margin (blended) for S&P 500 companies is currently pegged at 11.1 percent. Of the 11 sectors, information technology has the highest margin. In 1Q18, it was 20.3 percent, with 4Q17 even higher at 23.4 percent (Chart 3). (At 6.4 percent, consumer staples had the least operating margin in 1Q18.)
It is too soon to say if this margin contraction in 1Q18 has anything to do with how tech-heavy indices are performing this year.
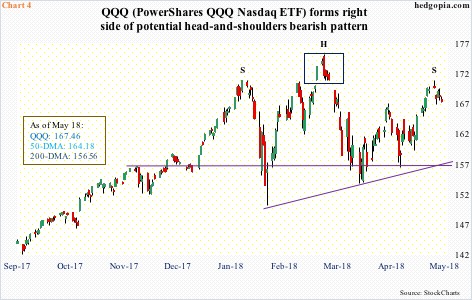
The Nasdaq 100 index/QQQ (PowerShares QQQ Nasdaq ETF) peaked on January 26 before coming under massive pressure in the next 10 sessions. The rally post-reversal low of February 9 resulted in a new high on March 13. But it turns out the breakout was false, followed by an island reversal (box in Chart 4).
While the bulls can point to the fact that QQQ ($167.46) has made higher lows since that February 9 low, bears showed up last week at a critical level. Last Monday’s intraday high of $170.82 can potentially form the right side of a head-and-shoulders pattern. The neckline is not tested until $156-157, which is where the 200-day moving average lies. Still, the fact that selling pressure rose at that level is a concern.
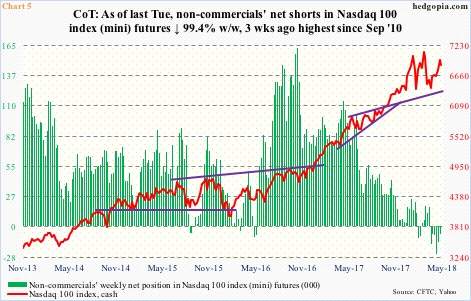
Amidst this, non-commercials are not getting very aggressive. In fact, three weeks ago they were net short nearly 25,000 contracts in Nasdaq 100 index (mini) futures – the most since September 2010. Last week, this dwindled to 38.
If history repeats itself and these traders start building net longs, the cash gets a tailwind. But will they?
At least near term, it increasingly looks like they are better off waiting.
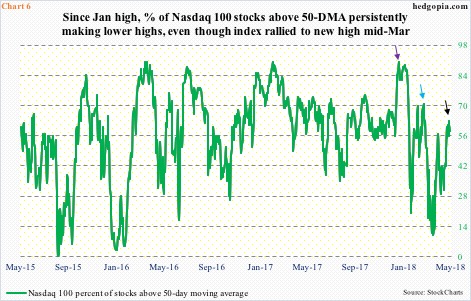
One of the consistent knocks on the Nasdaq 100 of late is that the rally is led by the big guys, which is not all that surprising given the top five – AAPL (12.1 percent), AMZN (9.9 percent), MSFT (9.5 percent), GOOG/L (8.8 percent, both A and C class) and FB (5.5 percent) – constitute nearly 46 percent of QQQ.
This year, participation persistently got thinner. Early January, the percent of Nasdaq 100 stocks above the 50-day was 90 percent (indigo arrow in Chart 6). Later in March when the index rallied to a fresh high, less than 71 percent were above that average (blue). Last Wednesday, the green line retreated from 63 percent (black) to end the week at 58 percent.
At least on the daily chart, there is room for this metric to continue lower.
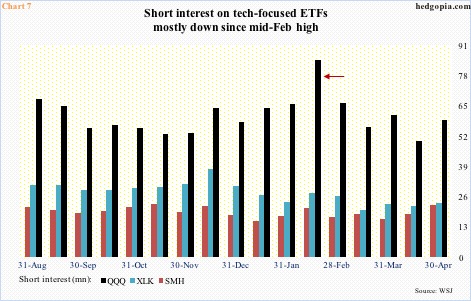
All this does not make for a conducive environment for short squeeze. Short interest is low – relatively speaking, that is.
Chart 7 plots short interest for QQQ, XLK (SPDR technology sector ETF) and SMH (VanEck Vectors semiconductor ETF) going back to last August. Their most recent peak occurred mid-February (arrow). All three ETFs bottomed on February 9. Then came the squeeze. From that high through end-April, short interest fell on both QQQ and XLK, while SMH’s is a little higher.
In the event that, let us say, QQQ manages to rally toward last week’s highs, shorts likely get active, with decent odds of success near term. Wait and watch for now.
Nasdaq 100 Breakout Fri Follows In Small-Caps’ Footsteps – Large-Caps Next, Or Not? By: Hedgopia | June 4, 2018
Major US equity indices all peaked late January – the S&P 500 large cap index, the Dow industrials and the Nasdaq 100 index on the 26th and the Russell 2000 small cap index on the 24th. This was followed by a sharp double-digit decline. Then they all bottomed on February 9. The progress since – or a lack thereof – has been divergent.
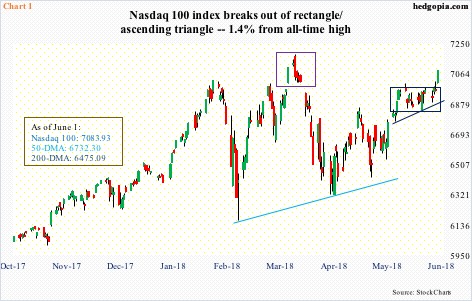
Post-February 9 trough, the Nasdaq 100 (7083.93) was the first to rally to a new high, rising to an intraday high of 7186.09 on March 13. But it turns out the breakout was false. Soon a potentially bearish island reversal developed on the daily chart (indigo box in Chart 1). The subsequent decline stopped early April at a higher low, followed by another in the last week of April. Buying pressure was becoming evident, but the bulls were still not able to break free of congestion. Until last week.
The Nasdaq 100 remained trapped inside a rectangle for nearly a month. Also in play was an ascending triangle of the same duration. Friday, post-May jobs report, the index broke out. It is now only 1.4 percent from the March high. At least a test is the path of least resistance near term.
In May, 223,000 non-farm jobs were created. This was better than what the consensus was expecting. With this, the five-month average this year is now 207,000. If this pace sustains, 2018 would break a three-year downtrend in job creation.
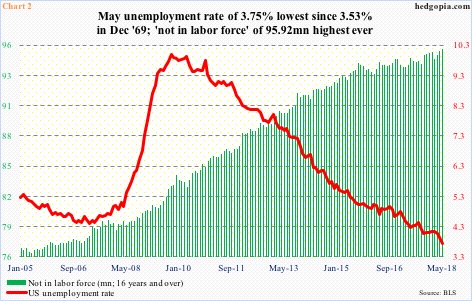
In 2017, the monthly average was 182,000, versus 195,000 in 2016, 226,000 in 2015, and 250,000 in 2014. The year-to-date pace of job creation is commendable given the US economy is less than a month away from completing nine years of recovery. It is mature. Many would say it is long in the tooth. The unemployment rate fell to 3.75 percent in May – the lowest since December 1969.
If there is a blemish in this hunky-dory story, it is that all this job growth is yet to put upward pressure on wages. Private-sector average hourly earnings rose 2.71 percent year-over-year in May. The last time this metric grew with a three handle was in April 2009. Critics can also point to the number of Americans who have opted out of the labor force. In May, there were 95.9 million of them – a new record (Chart 2). This in and of itself helps put downward pressure on the unemployment rate.
Despite all this, the jobs picture remains healthy. The collective wisdom of crowds agrees.
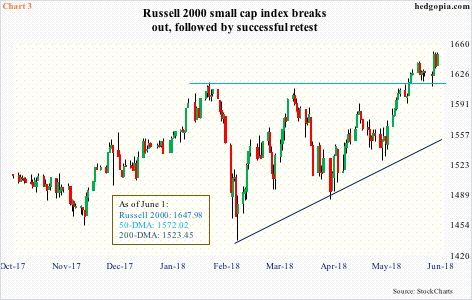
Small-caps, which are more domestically oriented than their large-cap peers, act the strongest.
Of the afore-mentioned indices, the Russell 2000 is the first to sustainably rally to a new high in the wake of the February low. As was the case with the Nasdaq 100, it too progressively made higher lows (Chart 3). Come mid-May, it took out the old high. In the last several sessions, the breakout has been successfully retested.
What is the message here? Is this – small-cap outperformance – a signal or a noise?
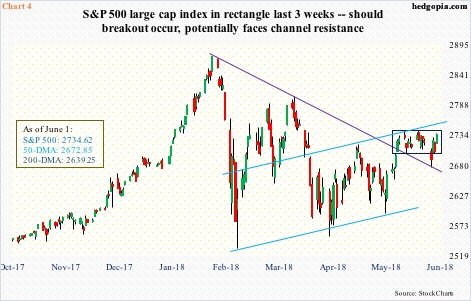
The problem right now is that large-caps are not following small-caps’ lead.
The S&P 500 has been in a box the last three weeks. As a matter of fact, Monday last week, it fell out of it, but the 50-day moving average came to the rescue. This support also approximated a falling trend line from late January which the index broke out of three weeks ago (Chart 4). In fact, it began going sideways right after that breakout.
Here is the thing.
As is the S&P 500, the Nasdaq 100 too was trapped in a box until Friday last week. Now, the road is clear for the latter to test its old high, and possibly beyond. Similarly, a rectangle breakout on the S&P 500 opens the door for a test of the upper bound of the ascending channel it is in. This lies around 2760, which is where the daily upper Bollinger band lies.
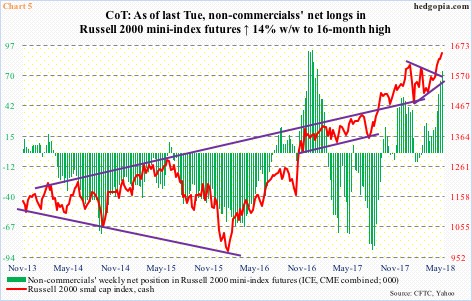
The other thing is, non-commercials fully took part in the latest small-cap rally. In the week ended March 6, they were net short Russell 2000 mini-index futures. Then they switched. As of last Tuesday, they were net long 74,239 contracts – a 16-month high (Chart 5). No such thing when it comes to the S&P 500.
Non-commercials are still net long e-mini S&P 500 futures, but have been cutting back since peaking early May. Their most recent holdings are 124,079 contracts, down 33 percent week-over-week.
In this respect, what is transpiring – or could transpire – in Nasdaq 100 index (mini) futures is worth noting. Last Tuesday, after eight weeks of staying net short, they switched to net long – a mere 6,371 contracts. But if past is prologue, this has the potential to go up (charts for both Nasdaq 100 and S&P 500 futures here). Could last Friday’s rectangle breakout set in motion this process?
Better yet, should the S&P 500 break out this week, would non-commercials begin to add to net longs? This is what the bulls are hoping for. Last Friday’s breakout on the Nasdaq 100 has bolstered their hope – the idea that small-caps seem to be pulling tech higher, and now it is large-caps’ turn.
Else, the longer large-caps lag, the easier it is to poke holes in small-caps’ leadership story. What to watch out for in this scenario? On the S&P 500, it is 2532. That is the line in the sand.
 News
News  Market Data
  Discover