


| Followers | 679 |
| Posts | 140780 |
| Boards Moderated | 36 |
| Alias Born | 03/10/2004 |
Thursday, March 29, 2018 9:00:38 AM
Nasdaq 100 Getting Oversold – Turning XLK Credit Call Spread Into Iron Condor
By: Hedgopia | March 29, 2018
Risks are building medium- to long-term, but the Nasdaq 100 is getting oversold on the daily chart.
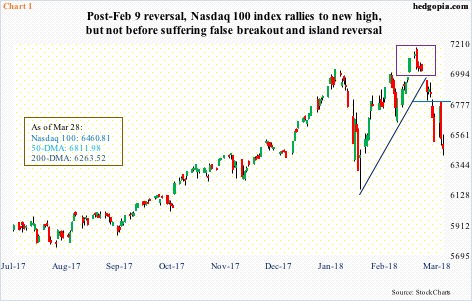
After major U.S. equity indices reversed on February 9, tech-heavy indices were the only ones to rally to new highs.
The Nasdaq 100 index peaked on January 26 at 7022.97, which then got taken out on March 9, subsequently rising to a new high of 7186.09 two trading sessions later. Other indices, such as the S&P 500 large cap index, the Dow Industrials and the Russell 2000 small cap index could never surpass their respective late-January highs. The latter came close.
As it turns out, the breakout on the Nasdaq 100 was false. Soon, an island reversal developed (box in Chart 1). The new high itself came in a bearish engulfing session.
As things stand, the technical picture has deteriorated on these indices. The 50-day moving average, for example, has turned lower on all these. On Tuesday, the Nasdaq 100 came within 24 points of testing the average, and was rejected.
One of the things tech in particular has been a beneficiary of is persistent aggression shown by the shorts.
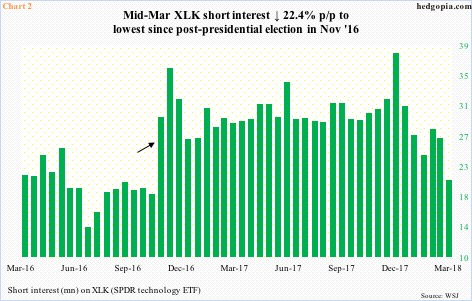
Post-presidential election in November 2016, short interest on XLK (SPDR tech sector ETF), took off (arrow in Chart 2). Shorts stayed put, as the ETF rallied, and rallied even more. The green bars peaked mid-December last year. Short interest has dropped 46.5 percent since then. It was a classic squeeze, and that tailwind is now pretty much gone. This is likely one reason why the bulls were unable to build on the breakout two weeks ago.
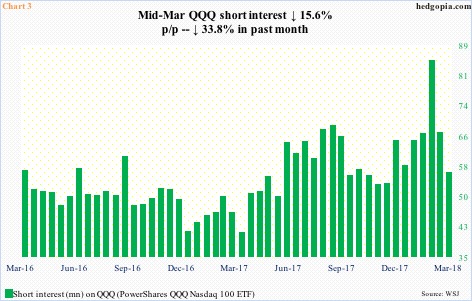
The footprint of short squeeze is also evident in QQQ (PowerShares QQQ Nasdaq 100 ETF).
By mid-February this year, short interest stood at 84.6 million. A month later, this had declined 33.8 percent to a three-and-a-half-month low.
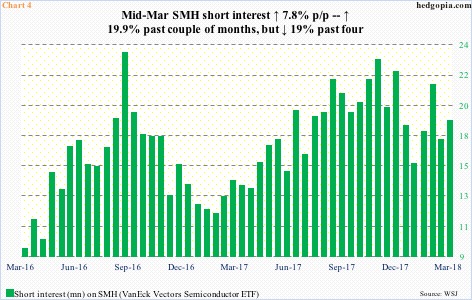
On SMH, shorts have not left in droves – as in XLK and QQQ – but the trend is down in the past four months (Chart 4). Although going back a year, the trend is still up. These shorts are staying with their losing positions; in 2017 alone, the ETF jumped 36.5 percent.
In the right circumstances for the bulls, this is a potential source of squeeze.
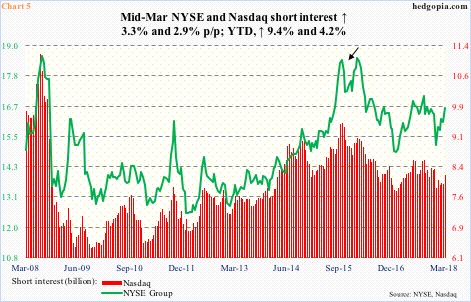
Ditto with the Nasdaq, where short interest is up 4.2 percent year-to-March 15, although this is much weaker than the 9.4-percent buildup on the NYSE over the same time period. The current level of short interest is also nowhere near what it was during September 2015-February 2016 (arrow in Chart 5), which, once it peaked, persistently provided a tailwind for stocks. The latter reached a major bottom in February 2016.
So this is where things stand in tech.
First, short interest is not as elevated as in recent past. Second, technicals are weakening. The latter in particular is worth paying attention to.
On the Nasdaq 100, both weekly and monthly momentum indicators have begun to turn lower. In a worse-case scenario for the bulls, in time they can go a lot lower. With one session to go before March is over, February’s hanging man is followed by another reversal candle with a long wick. Risks are building medium- to long-term.
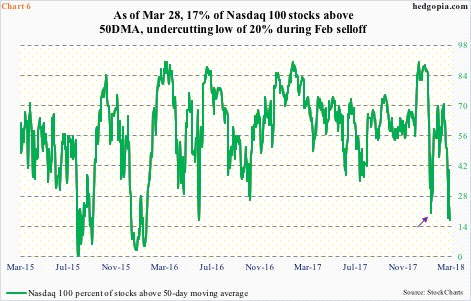
Near-term, different variables might be in play. As of Wednesday, merely 17 percent of Nasdaq 100 stocks were above their 50-day, undercutting the prior low from February 8 (arrow in Chart 6). Wednesday produced a spinning top candle. The daily chart is getting oversold. Worse, the 200-day, which is a little over three percent away, gets tested.
In this situation, a credit put spread will at least earn some premium.
Hypothetically, in the April 6 expiration, XLK 62 and 61 puts are respectively selling for $0.55 and $0.25. A credit put spread nets $0.30.
On March 20, a hypothetical credit call spread on XLK was initiated in which 69 of the same expiration was sold and 70 bought for a premium of $0.41. Combined, this is how they look.
XLK April 6 iron condor
• Long 70 call
• Short 69 call
• Short 62 put
• Long 61 put
This has now turned into an iron condor – a combination of a bear call spread and a bull put spread. It is a non-directional, limited-risk option strategy. Net credit is $0.71. Maximum profit is realized if by next Friday XLK ($64.15) lies between $69 and $62. The upper breakeven point is $69.71 and the lower $61.29, with $0.29 at risk.
https://hedgopia.com/nasdaq-100-getting-oversold-turning-xlk-credit-call-spread-into-iron-condor/
• DiscoverGold
Click on "In reply to", for Authors past commentaries
By: Hedgopia | March 29, 2018
Risks are building medium- to long-term, but the Nasdaq 100 is getting oversold on the daily chart.

After major U.S. equity indices reversed on February 9, tech-heavy indices were the only ones to rally to new highs.
The Nasdaq 100 index peaked on January 26 at 7022.97, which then got taken out on March 9, subsequently rising to a new high of 7186.09 two trading sessions later. Other indices, such as the S&P 500 large cap index, the Dow Industrials and the Russell 2000 small cap index could never surpass their respective late-January highs. The latter came close.
As it turns out, the breakout on the Nasdaq 100 was false. Soon, an island reversal developed (box in Chart 1). The new high itself came in a bearish engulfing session.
As things stand, the technical picture has deteriorated on these indices. The 50-day moving average, for example, has turned lower on all these. On Tuesday, the Nasdaq 100 came within 24 points of testing the average, and was rejected.

One of the things tech in particular has been a beneficiary of is persistent aggression shown by the shorts.
Post-presidential election in November 2016, short interest on XLK (SPDR tech sector ETF), took off (arrow in Chart 2). Shorts stayed put, as the ETF rallied, and rallied even more. The green bars peaked mid-December last year. Short interest has dropped 46.5 percent since then. It was a classic squeeze, and that tailwind is now pretty much gone. This is likely one reason why the bulls were unable to build on the breakout two weeks ago.

The footprint of short squeeze is also evident in QQQ (PowerShares QQQ Nasdaq 100 ETF).
By mid-February this year, short interest stood at 84.6 million. A month later, this had declined 33.8 percent to a three-and-a-half-month low.

On SMH, shorts have not left in droves – as in XLK and QQQ – but the trend is down in the past four months (Chart 4). Although going back a year, the trend is still up. These shorts are staying with their losing positions; in 2017 alone, the ETF jumped 36.5 percent.
In the right circumstances for the bulls, this is a potential source of squeeze.

Ditto with the Nasdaq, where short interest is up 4.2 percent year-to-March 15, although this is much weaker than the 9.4-percent buildup on the NYSE over the same time period. The current level of short interest is also nowhere near what it was during September 2015-February 2016 (arrow in Chart 5), which, once it peaked, persistently provided a tailwind for stocks. The latter reached a major bottom in February 2016.
So this is where things stand in tech.
First, short interest is not as elevated as in recent past. Second, technicals are weakening. The latter in particular is worth paying attention to.
On the Nasdaq 100, both weekly and monthly momentum indicators have begun to turn lower. In a worse-case scenario for the bulls, in time they can go a lot lower. With one session to go before March is over, February’s hanging man is followed by another reversal candle with a long wick. Risks are building medium- to long-term.

Near-term, different variables might be in play. As of Wednesday, merely 17 percent of Nasdaq 100 stocks were above their 50-day, undercutting the prior low from February 8 (arrow in Chart 6). Wednesday produced a spinning top candle. The daily chart is getting oversold. Worse, the 200-day, which is a little over three percent away, gets tested.
In this situation, a credit put spread will at least earn some premium.
Hypothetically, in the April 6 expiration, XLK 62 and 61 puts are respectively selling for $0.55 and $0.25. A credit put spread nets $0.30.
On March 20, a hypothetical credit call spread on XLK was initiated in which 69 of the same expiration was sold and 70 bought for a premium of $0.41. Combined, this is how they look.
XLK April 6 iron condor
• Long 70 call
• Short 69 call
• Short 62 put
• Long 61 put
This has now turned into an iron condor – a combination of a bear call spread and a bull put spread. It is a non-directional, limited-risk option strategy. Net credit is $0.71. Maximum profit is realized if by next Friday XLK ($64.15) lies between $69 and $62. The upper breakeven point is $69.71 and the lower $61.29, with $0.29 at risk.
https://hedgopia.com/nasdaq-100-getting-oversold-turning-xlk-credit-call-spread-into-iron-condor/
• DiscoverGold
Click on "In reply to", for Authors past commentaries
Information posted to this board is not meant to suggest any specific action, but to point out the technical signs that can help our readers make their own specific decisions. Your Due Dilegence is a must!
• DiscoverGold
Join the InvestorsHub Community
Register for free to join our community of investors and share your ideas. You will also get access to streaming quotes, interactive charts, trades, portfolio, live options flow and more tools.

