Crude Oil (USO) Weekly Wrap: Daily & Weekly Charts By: Carl Swenlin | January 12, 2018
IT Trend Model: BUY as of 9/6/2017
LT Trend Model: BUY as of 11/2/2017
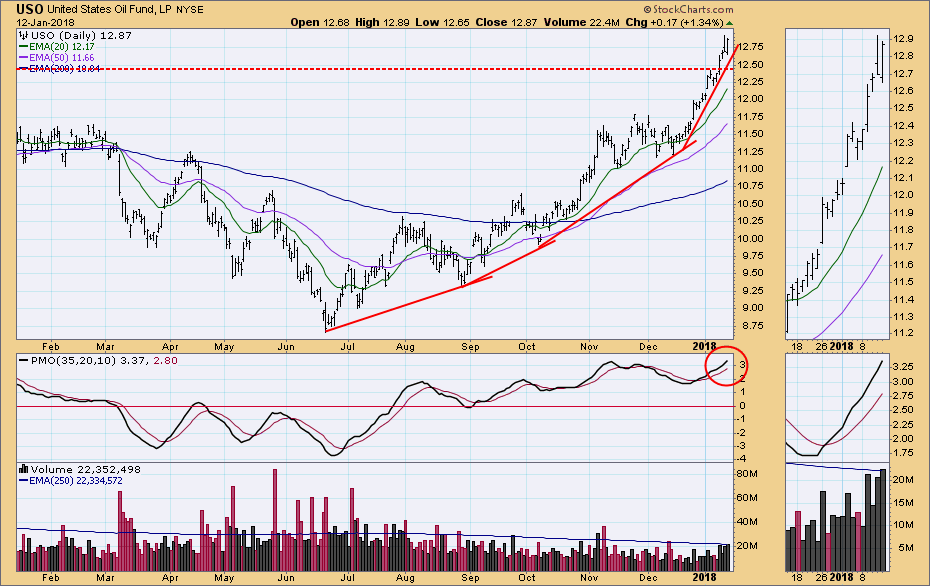
Daily Chart: USO has made a decisive breakout through the top of the 2-year trading range at about 12.50. Since the breakout is "decisive" (3% or more), it is unlikely that USO will fall back into the range when the support is tested on a pullback.
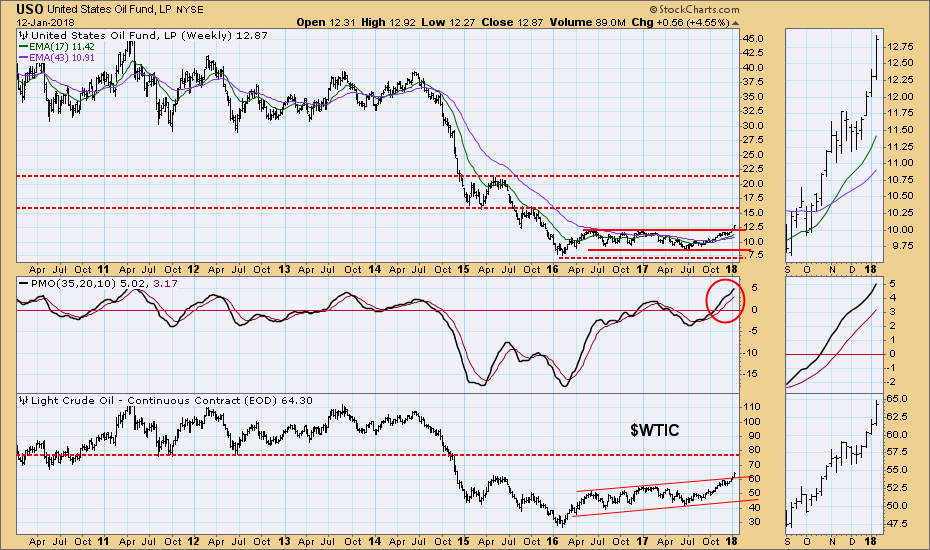
Weekly Chart: Here we can see longer-term resistance at around 15.80 for USO, and around 78.00 for $WTIC. . .
 News
News  Market Data
  Discover