


| Followers | 689 |
| Posts | 143817 |
| Boards Moderated | 35 |
| Alias Born | 03/10/2004 |
Saturday, January 13, 2018 10:15:43 AM
By: Carl Swenlin | January 12, 2018
IT Trend Model: BUY as of 9/6/2017
LT Trend Model: BUY as of 11/2/2017
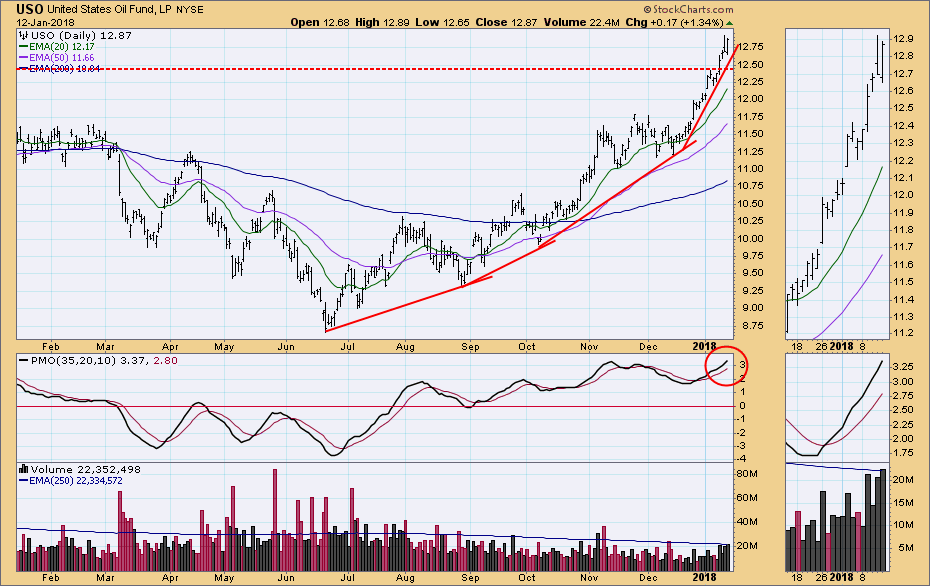
Daily Chart: USO has made a decisive breakout through the top of the 2-year trading range at about 12.50. Since the breakout is "decisive" (3% or more), it is unlikely that USO will fall back into the range when the support is tested on a pullback.
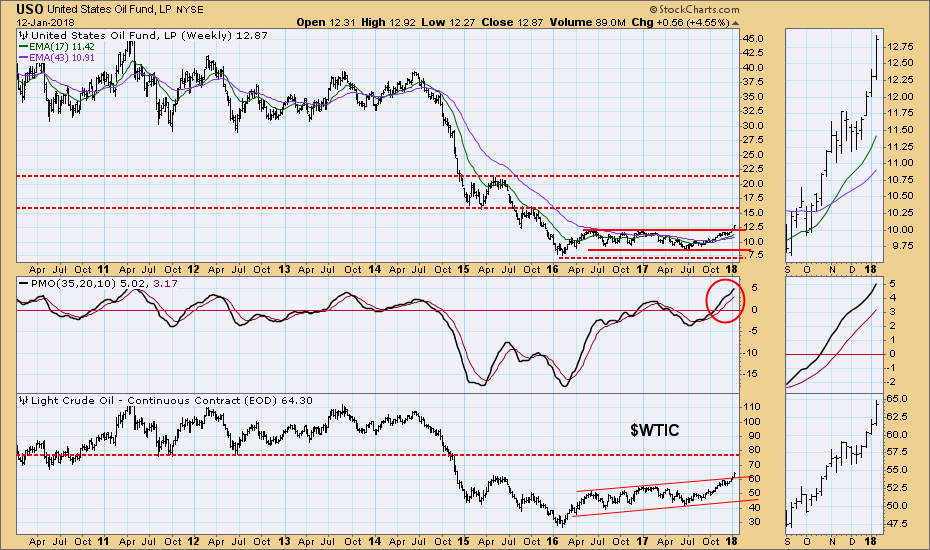
Weekly Chart: Here we can see longer-term resistance at around 15.80 for USO, and around 78.00 for $WTIC. . .
* * *
http://stockcharts.com/articles/decisionpoint/2018/01/dp-weekly-wrap-zoom.html
• DiscoverGold
Click on "In reply to", for Authors past commentaries
Information posted to this board is not meant to suggest any specific action, but to point out the technical signs that can help our readers make their own specific decisions. Your Due Dilegence is a must!
• DiscoverGold
VHAI - Vocodia Partners with Leading Political Super PACs to Revolutionize Fundraising Efforts • VHAI • Sep 19, 2024 11:48 AM
Dear Cashmere Group Holding Co. AKA Swifty Global Signs Binding Letter of Intent to be Acquired by Signing Day Sports • DRCR • Sep 19, 2024 10:26 AM
HealthLynked Launches Virtual Urgent Care Through Partnership with Lyric Health. • HLYK • Sep 19, 2024 8:00 AM
Element79 Gold Corp. Appoints Kevin Arias as Advisor to the Board of Directors, Strengthening Strategic Leadership • ELMGF • Sep 18, 2024 10:29 AM
Mawson Finland Limited Further Expands the Known Mineralized Zones at Rajapalot: Palokas step-out drills 7 metres @ 9.1 g/t gold & 706 ppm cobalt • MFL • Sep 17, 2024 9:02 AM
PickleJar Announces Integration With OptCulture to Deliver Holistic Fan Experiences at Venue Point of Sale • PKLE • Sep 17, 2024 8:00 AM

