Buy:sell, daily shorts & pps 06/19 2017 EOD
Everything I can see suggests we are effectively in a very short-term consolidation. Indications are it won't last too long and the exit is most likely to the down side.
There was a PR about an order for two C1000 S units to provide power from waste gas. Just as has happened so often, the effect on the market somewhat negative, The low of the day was flat while the high was down -2.10% and the VWAP was down -0.49%. All on low volume.
Today was a long, low-volume flattish period through about 12:30, a ~10-minute step up into another long, low-volume flattish period through about 14:09, a higher-volume couple minutes drop to do a short wide sideways with more volume through about 14:50, and finally a long very low-volume sideways in about the same range as the day's first three hours. The close and volume increase were the only things that showed improvement over yesterday and neither of them were very good - volume still extremely low and the close still below, by ~8/10ths of a cent, the close of two days ago.
There were no pre-market trades.
B/a just before open was 100:500 $0.6112/$0.7390
09:30-11:26 opened the day with a 13,385 sell for $0.68 & $0.68 x 3, x 5, x 3,750 (appears to be one trade of ~17K). B/a just after open was 16.7K:4.1K $0.6800/99. Then came 9:33's 1.2K $0.6898, 9:36's 300 $0.6888, 9:39's b/a 104:2.1K $0.6802/89. Well, this began extremely low/no-volume $0.6888/9 with a very slowly falling, extremely low/no-volume range. B/a at 9:49 was 204:2K $0.6802/88, 10:02 4.1K:2.6K $0.6840/85. At 10:14 range was down to $0.6840/61. B/a at 10:17 was 4.1K:100 $0.6840/81 (offers falling), 10:32 4.1K:200 $0.6840/72. Volume was interrupted by 10:39's 4K $0.6840. Volume and price were interrupted by 10:47's 10.4K $0.6840/56/73 (1.3K)/74 (1.8K)/$0.69 (6K)/0.6840 (900). B/a at 10:47 was 2.1K:1.1K $0.6840/73. Price was interrupted by 10:59's 200 $0.6871/$0.6914. B/a at 11:03 was 1K:1.2K $0.6840/$0.6850, 11:17 1K:100 $0.6840/8. The period ended on 11:26's 1.7K $0.6845/6/$0.6850 (1.2K).
11:27-12:07 began extremely low/no-volume $0.6850/$0.6917 on 11:28's 110 $0.6850. B/a at 11:36 was 3.3K:87 $0.6850/$0.6914, 11:47 2.9K:86 $0.6860/$0.6914 (offers backed by presented $0.6950 x 40, $0.6999 x 1.2K). Volume was interrupted by 11:51's 2.5K $0.6866. B/a at 12:02 was 5.1K:86 $0.6860/$0.6914 (offers backed by presented $0.6950 x 40, $0.6998 x 1.7K). The period ended on 12:07's 10.7K $0.69 (5.4K)/$0.6860 (5.3K).
12:08-14:10, after nine no-trades minutes, began an extremely low/no-volume rise from $0.6861/$0.6925, after 12:17's 6K $0.6996. B/a at 12:19 was 2.2K:86 $0.6900/14 (offers backed by presented $0.6950 x 40, $0.6999 x 100). 12:43's 100 hit $0.70. B/a at 12:43 was 2:86 $0.6900/14 (presented bids backing were $0.6865 x 7K and offers backing $0.6950 x 40, $0.70 x 23, $7099 x 300). 12:52's 5.9K hit $0.7077/8 (4.9K). B/a at 13:02 1.6K:2.5K $0.7000/79. 13:19's 100 hit $0.7091. B/a at 13:19 was 100:1K $0.7000/98, 13:33 100:1K $0.7000/98, 13:47 100:1K $0.7002/97. Volume was interrupted by 13:38's 2.2K $0.7097 (2.1K)/01. 13:43. B/a at 14:04 was 2:3.5K $0.69/$0.7089 (bids backed by presented $0.6880 x 61 & $0.6866 x 100). The period ended on 14:10's 1.7K $0.7078 (1.5K)/$0.6905.
14:11-15:28, after four no-trades minutes, began a wide range, which narrowed over time, $0.6866/$0.7089 on high-volume minutes breaking up strings of extremely low/no-volume minutes, on 14:15's 13.6K $0.69. B/a at B/a at 14:17 was 200:10 $0.6888/$0.70 (offers backed by presented $0.7089 x 3.5K), 14:36 18.9K:100 $0.6850/$0.70 (bids rising), 14:48 7.9K:228 $0.6865/$0.70, 15:02 300:3.4K $0.6902/$0.7089, 15:17 300:[6.2K $0.6904/$0.7050. The period ended on 15:28's 190 $0.6911.
15:29-16:00, during the first nineteen no-trades minutes has b/a at 15:34 of 300:6.1K $0.6905/$0.7050 and 15:47 of 300:3K $0.6905/99. Trade began with 15:48's 7.3K $0.6916 (7K)/05 and 15:50's 5K $0.6905. The rest of the period did extremely low/no-volume $0.69/$0.7050 (mostly low $0.69xx) and ended the period and day on 15:59's 400 $0.7040, the official close because 16:00's only trade was an odd-lot 4 shares for $0.6910.
There were no AH trades.
Including the opening trade (closing didn't qualify), there were 13 larger trades (>=5K & 4 4K+) totaling 89,861, 59.79% of day's volume, with a $0.6909 VWAP. Excluding the opening trade, there were 12 larger trades totaling 76,476, 50.88% of day's volume, with a $0.6928 VWAP. For the volume, the counts seem a bit on the high side. The percentage day's volume is well above "normal". The VWAP including the opening trade is right at the day's VWAP of $0.6909, unusual. Excluding the opening trade the VWAP is marginally higher than the day's VWAP. Looking at the fairly even distribution of larger trades in the various periods, VWAPs, volumes, and buy percentage changes, I don't think there's a lot I can glean from that other than the MMs were trying to make some money on a low-volume day.
Considering the PR, it's likely mostly day traders involved in today's market I would guess. Ending Period Period Period __Per. Trade_ Period_ % Day_ Per. End
Period Volume Low High _Dollar Val._ VWAP___ Volume Buy ~%
11:26 50448 $0.6800 $0.6914 $34,520.68 $0.6843 33.56% 36.46% Incl 09:30 $0.6800 13,385 10:47 $0.6900 6,000
12:07 15390 $0.6850 $0.6917 $10,590.44 $0.6881 10.24% 36.97% Incl 12:07 $0.6860 4,575 $0.6900 4,725
14:10 22118 $0.6861 $0.7097 $15,575.70 $0.7042 14.72% 49.86% Incl 12:17 $0.6996 6,000 12:52 $0.7078 4,900
15:28 46394 $0.6865 $0.7089 $32,108.44 $0.6921 30.87% 39.20% Incl 14:15 $0.6900 5,800 7,600
14:30 $0.6866 4,000 14:35 $0.6865 13,832
14:54 $0.7089 7,044
16:00 14704 $0.6900 $0.7050 $10,182.90 $0.6925 9.78% 36.43% Incl 15:48 $0.6916 7,000 15:50 $0.6905 5,000
The buy percentage and VWAP movements seem reasonably well correlated. With the buy percentages were they were and VWAP moving with them I suspect no ATM use today.
On the traditional TA front, movements were: __Open_ ___Low_ __High_ _Close_ Volume_
Today -4.23% 0.00% -2.10% 2.03% 20.99%
Prior 0.00% -1.45% 0.68% -2.87% -26.61%
About the only good thing here was the close got back some of the prior loss (still down a penny from the close two days ago) on volume up ~21%, offering hope for a recovery to the upside. But with volume this low we can't really read any strength into the move of the close, it was more an effect of the usual bump up, from a range approximating the first three hours' range, in the latter part of the trading day to get back up to the flattish range seen ~12:30-14:10. It was an extremely low-volume bump but for the last couple minutes.
On my minimal chart about 80% of the day's range was below the declining fast EMA's $0.7047 (our close was $0.7040). With the slow EMA again rising while the fast EMA declines at a somewhat quick rate, I expect the fast EMA will cross below the slow EMA in just a couple days.
Yesterday I noted { Volume again dropped substantially and now is low enough that we can look for a very short consolidation (a couple days?). I doubt it can last much longer than that with this kind of volume though. } Although volume was up a bit it wasn't enough to make me consider changing that assessment - a couple days consolidation, of which today looks to be one, is the best I can see. Sans a major catalyst I expect weakness to appear again.
This is supported by the volume bars "cupping pattern". As it is to the upside, so it is to the downside. The left side of the pattern is forming now and I suspect shortly we'll see rising volume begin to for the right side as price weakens. That will not be a good sign.
As with yesterday, the descending channel (descending blue lines) upper support/resistance provided support. I suspect we'll eventually re-enter the descending channel and then hope for support from it's bottom line.
On my one-year chart, today's trade again dipped below the rising 10-day and falling 50-day SMAs. Unlike yesterday, today managed to recover and close at $0.7040, marginally higher than the 10-day's $0.7035 and 50-day's $0.7029. The 50-day continued the decline begun three days back. The 10 and 20-day are still rising, so there is again a modicum of hope that the price decline will begin to slow. There's currently no indications of that.
Yesterday the oscillators I watch had weakening, for the second consecutive day, in accumulation/distribution and in all others. RSI was at neutral. Below neutral were Williams %R, full stochastic and ADX-related. Above neutral were momentum and MFI (untrusted by me).
Today had improvement in accumulation/distribution, RSI, momentum, and Williams %R. Deterioration occurred in MFI (untrusted by me), full stochastic and ADX-related. RSI, MFI and momentum are slightly above neutral. Williams %R, full stochastic and ADX-related are below neutral. Nothing is overbought or oversold but full stochastic is very close to entering that latter state.
The experimental 13-period Bollinger limits, $0.6171 and $0.7638 ($0.5989 and $0.7675 yesterday), continue converging with a slightly rising mid-point due to the lower limit rising faster than the upper limit declines.
All in, nothing better than continued (now?) short-term consolidation is suggested by what I see above. With the tepid response to the PR I would have to assume it won't last long and the exit will be with weakening.
Percentages for daily short sales and buys moved in the same direction but I can't call it "good" because both moved substantially further from the desired ranges (needs re-check). The short percentage went so low that I have to guess either the ATM was in use or those larger trades were predominantly intra-broker trades, which usually generate few short flags. Could be both I guess,
The spread narrowed, matching yesterday's suggestion that we would consolidate for a couple days. It's still a little wide though, suggesting that there's another day or so to get fully into consolidation. But IMO we're there already, for all practical purposes, and are likely to exit in a few days.
VWAP fell for the fourth consecutive day.
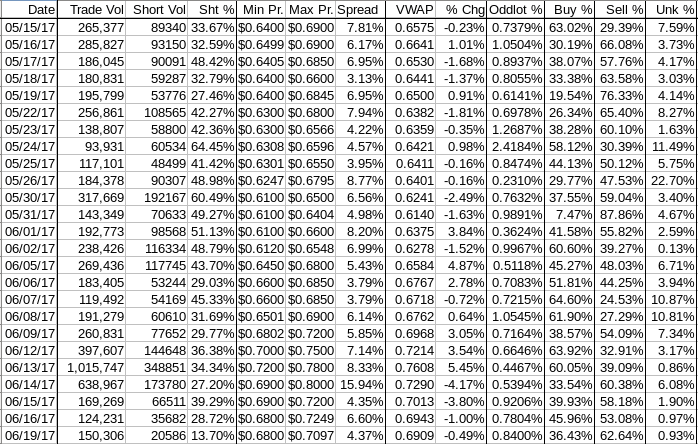
The VWAP's rolling average of the last twenty-four movements held steady for the third consecutive day at 14 negatives and 10 positives. Change since 05/15 is $0.0334, 5.07%, and the averages of the rolling 24-day period seen in the last few days (latest first) are now 0.2379%, 0.2486%, 0.2622%, 0.5035%, 0.6348%, 0.3385%, 0.1182%, -0.0514%, -0.2146%, and -0.2079%.
All in, the short and buy percentages strongly suggest no near-term strengthening is likely. The continued decline in the daily VWAPs combined with the turn from improvement to deterioration in the 24-days rolling averages changes suggests only more near-term weakening is likely.
The spread, with the slowing rate of VWAP decline (oldest first: -4.17%, -3.80%, -1.00%, -0.49%), agrees with the more conventional TA assessment - a like very short-term continued consolidation. As with that TA, the likely exit seems most likely to be downward.
Bill
 News
News  Market Data
  Discover


