SPY Weekly Wrap -- New Highs Climax By Carl Swenlin | June 3, 2017
Last week I wrote: ". . . our short- and intermediate-term indicators suggest that we will see a few more weeks of rally before another correction/consolidation." In the first two days of this short week price continued to consolidate the prior week's advance, and then the rally continued in the last two days, with price moving to new, all-time highs. Let's examine the prospects of such positive action continuing.
STOCKS
IT Trend Model: BUY as of 11/15/2016
LT Trend Model: BUY as of 4/1/2016
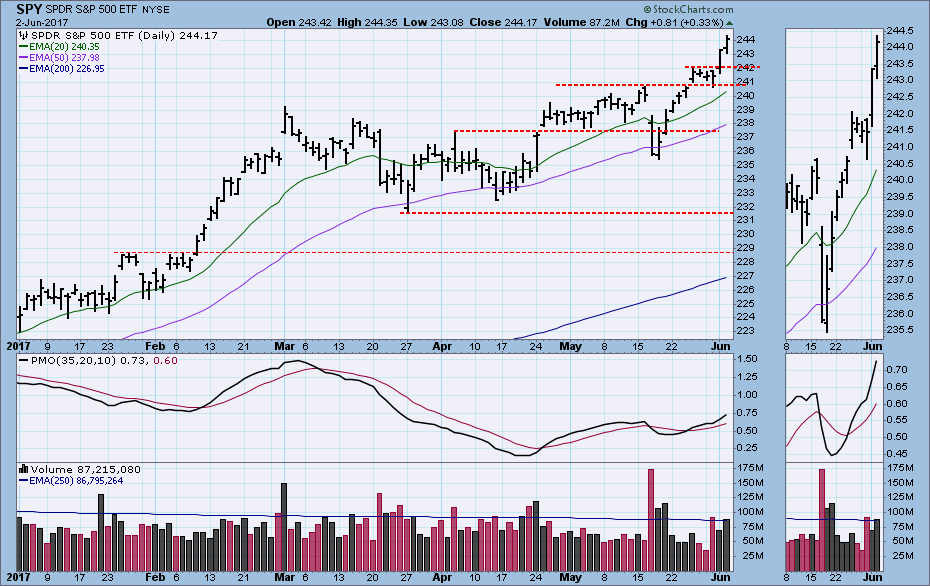
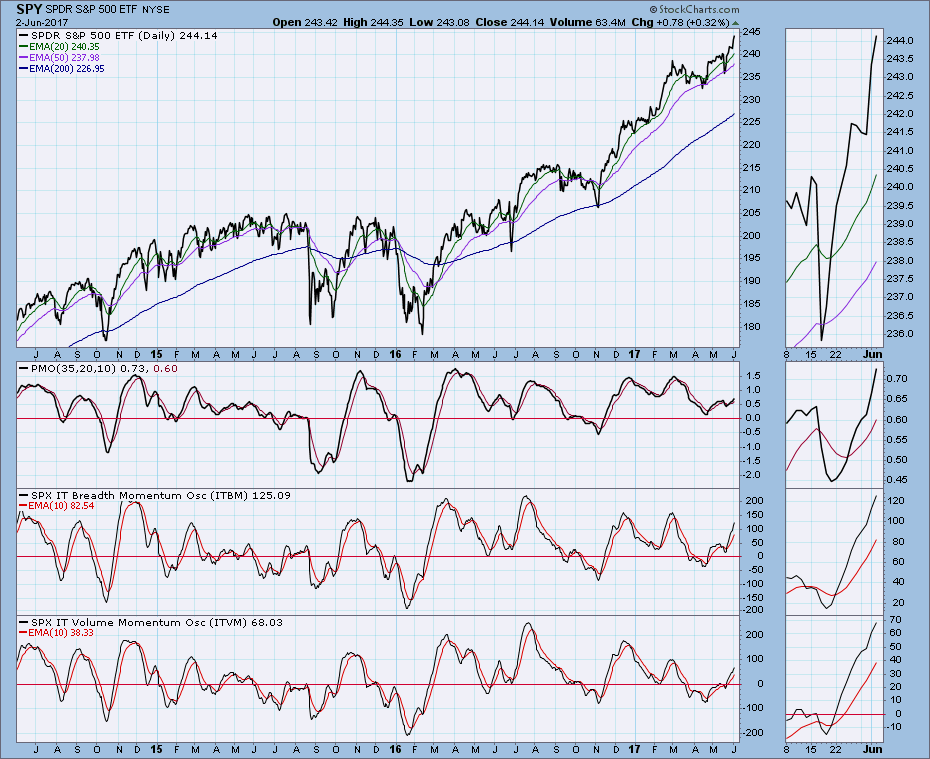
SPY is getting very overbought based upon the distance between price and its 200EMA, but the PMO is well below the top of its one-year range. The bull can push higher under these conditions, but it is difficult with the market being so overbought.
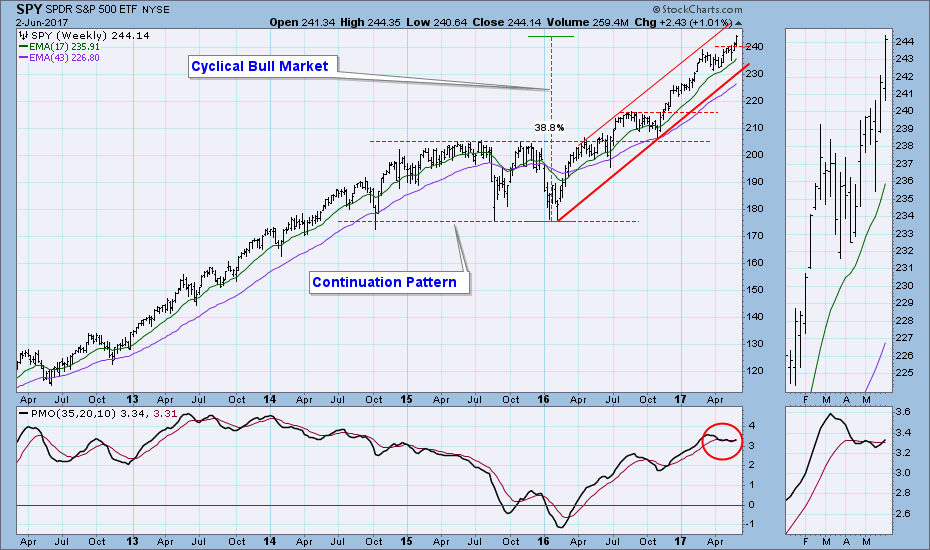
The weekly PMO is now rising above its signal line. I have drawn a line across the rising tops to highlight the channel. While the market is already overbought, it can still go higher within the rising trend channel.
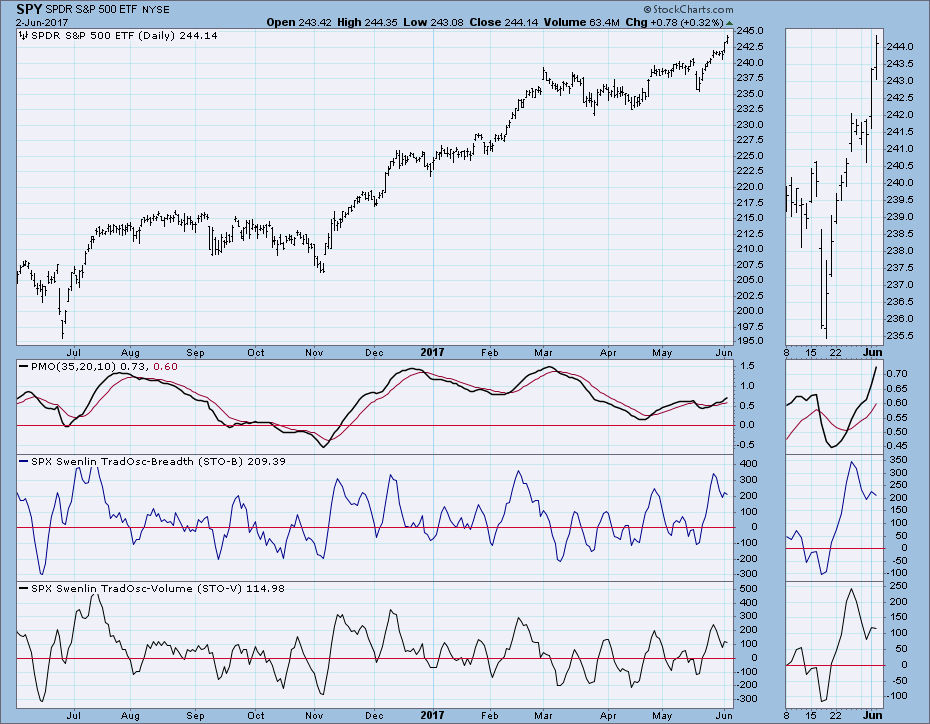
Short-Term Market Indicators: These indicators whipsawed this week, turning down on Friday. Friday's change in direction was not expected, but the cause was very narrow breadth on that day.
Intermediate-Term Market Indicators: The ITBM (breadth) is modestly overbought now, but all the indicators will allow for more price advance.
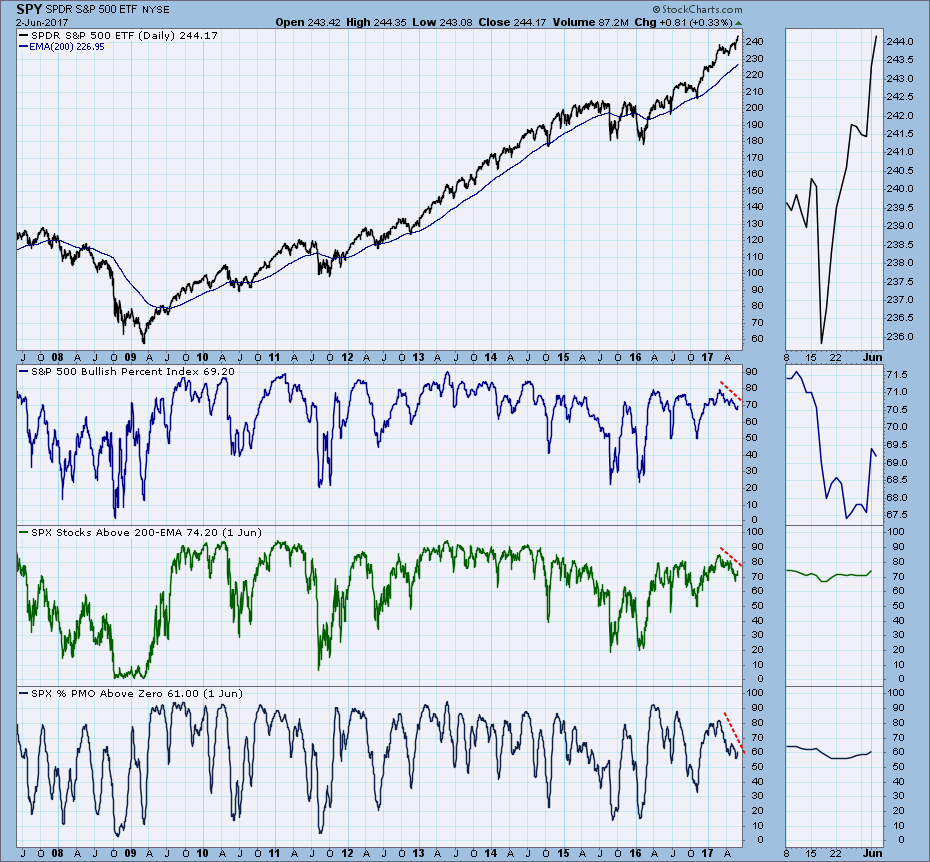
Participation: Last week we looked at the Bullish Percent Index (BPI), and this week I've added two more indicators that can help us gauge participation: Stocks Above 200EMA, and PMOs Above Zero. All three indicators have been retreating from their February tops, indicating that fewer and fewer stocks are participating in the rally. This week, they all turned up slightly, so it is possible that that internal trend may be about to reverse.
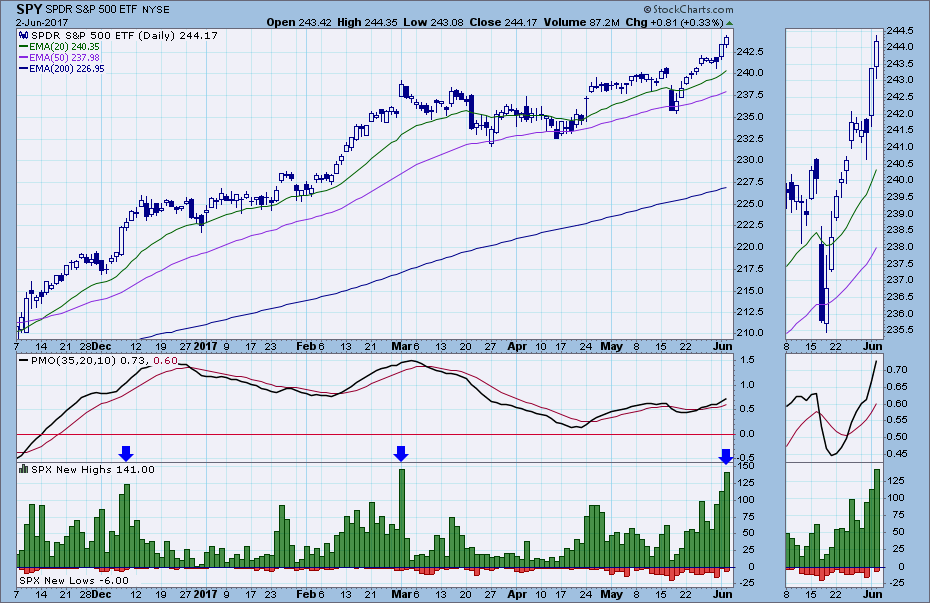
This next chart is really a short-term indication of participation. Friday's reading of S&P 500 New Highs was really climactic in nature. It could be an initiation climax which will launch the rally higher; however, since it occurred while a price advance was in progress, my best guess is that it is an exhaustion climax. We can see similar readings in December and March, which show us two possible outcomes. In December price continued higher for a few days, and then consolidated for three weeks. In March price went no higher, and it actually moved into a shallow but protracted correction. There are plenty of other possible variations, but I think we are close to a top that will usher us into a period of corrective activity.
Conclusion: While a weekly reminder may be too repetitive, I think it is important to remember that we are in a cyclical bull market within a longer-term secular bull market. In this environment we should expect situations to resolve bullishly more often than not. However, that does not preclude necessary corrections and consolidations from taking place. In fact, the spike in S&P 500 New Highs makes me think that the market may be on the verge of another consolidation or correction that could last several weeks. Until I saw that New Highs chart, I was thinking I would default in favor of the overall bull market and plan on a continued advance. Now my outlook is more cautious. . .
 News
News  Market Data
  Discover