heyjoe -- expecting EQBM to make a move like KRY's soon... RSI has been strong throughout the recent consolidating, while the price holds above the 50 day...
btw - those are GREAT patterns to look for... always scanning for those...:)
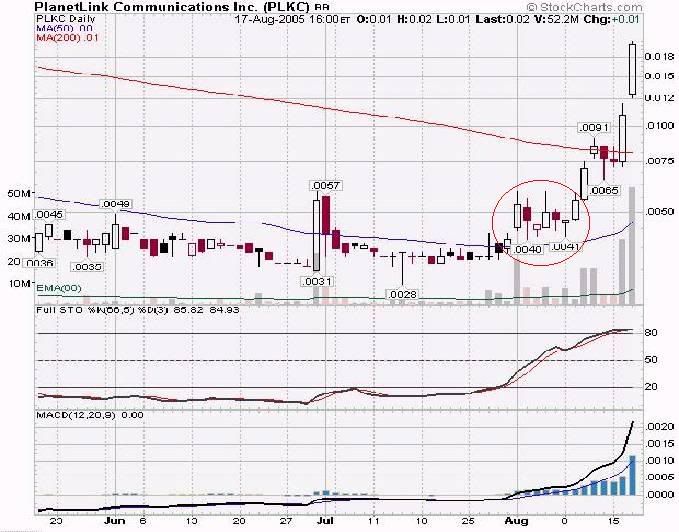
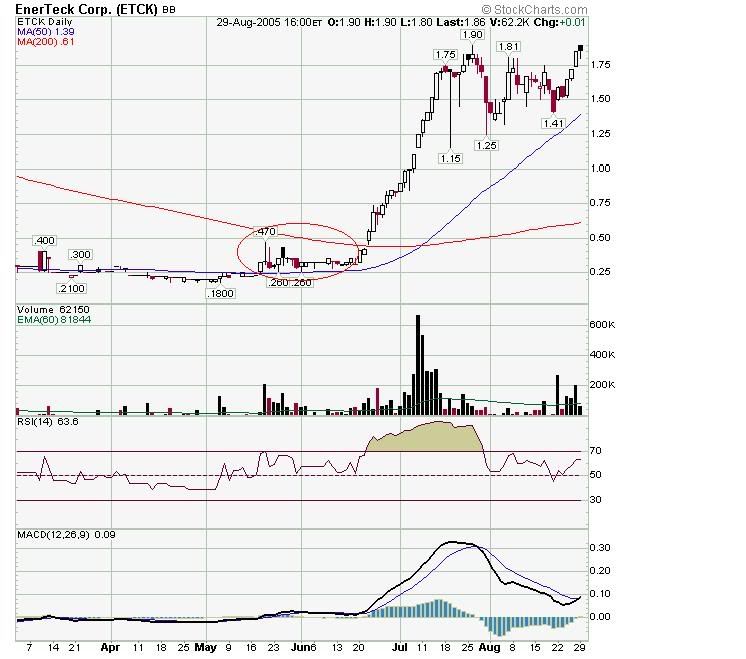
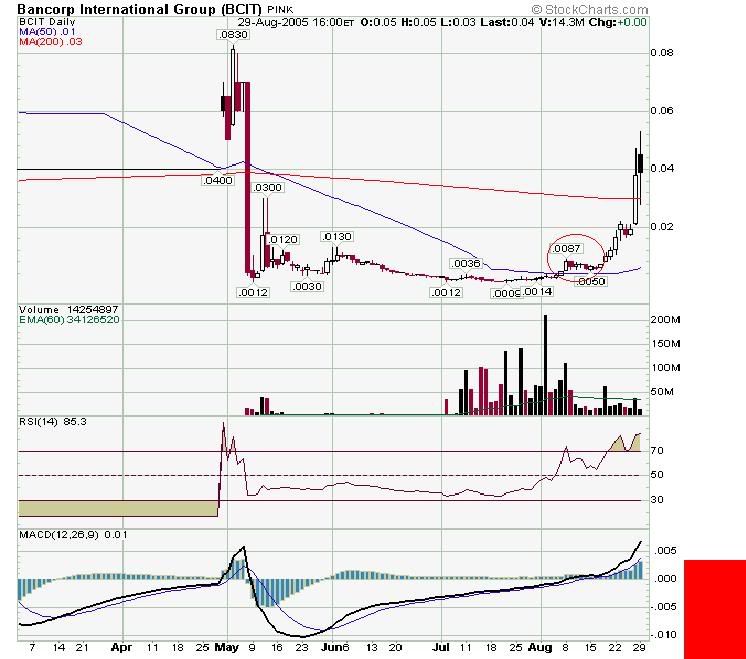
I kept some charts with similar patterns a while back (shown below eqbm chart)... plus some crappy notes...lol
The charts only show the move back then, AUG 2005... which just so happens to be our current time-frame!...
The pre-move setup is the red circles... I call it my 'squeeze' scan, where price moves above the 50 day, then gets squeezed between the 50 and 200 day...
let's hope we get a repeat performance!!
Notes: price below 50 for month, 50 below 200, price closes above 50, then price stays above 50 for 5 days or more, then it pops. The pops always goes to the 200. It may stay at 200 for 3-5 days then move up dramatically.
price may do the following after the initial pop: - come down and retest the 50 - Move sideways to touch the 50 as it rises - In most cases it would pay to hang on to it longer term as it rises
 News
News  Market Data
  Discover