Buy:sell, daily shorts & pps 05/03 2017 EOD
Conflicts exist between the conventional TA, which has started a migration towards a more bullish configuration, and my unconventional stuff. As is common, I'm going with my unconventional stuff (lots of details below) and say best case scenario is consolidation with a mild weakening bias while the most likely seems to be more weakening. The early signs of the down leg ending have dissipated with today's behavior and I consider $0.66 a viable next potential stop and reversal point.
I should note here that I think this is being caused by use of the ATM and/or shorters perceiving weakness and piling on.
There's no way I'll ever know for sure though.
The intra-day behavior, except for the last six minutes (details below) was typical in that we opened high, dropped, went flat, recovered some, went flat, dropped and went flat again. It was unusual in that the last six minutes of the day did about 16% of day's volume and set the day's high three cents above what it would have been sans those six minutes.
There were no pre-market trades.
B/a just before open was 500:1K $0.7017/$0.7390.
09:30-10:04 opened the day with a 240 sell for $0.72 & $0.71 x 380, $0.72 x 100, x 700, $0.71 x 100 (3). B/a just after open was 27K:351 $0.71/$0.7214. Then came 9:31's 100 $0.7113, 9:32's 300 $0.7157 (200)/$0.71, 9:33's 250 $0.71, 9:33's b/a 25.5K:4.3K $0.7100/98, 9:34's 300 $0.7100/1/0, 9:35's 6K $0.7100/1 (850)/00 (2.5K)/1 (1.6K)/0 (1K), 9:36's b/a 27K:2.7K $0.7100/96, 9:37's 300 $0.71, 9:38's 200 $0.71, 9:39's 2.3K $0.71, 9:40's 5.3K $0.71, 9:41's 1.6K $0.71, 9:41's b/a 17K:1.5K $0.7100/1, 9:42's 3.2K $0.7100/1 (1.9K)/0, 9:43's 3.8K $0.71, 9:44's 200 $0.71, 9:45's 200 $0.71, 9:46's 8.9K $0.7100/1/0/1/0 (7.6K), 9:47's 1.3K $0.71.
That kicked off mostly low-volume, some medium-volume, $0.7100/1 (mostly pecking the $0.71 bid with 100-200 share minutes). B/a at 9:52 was 5.7K:400 $0.7100/1, 9:57 8.4K:300 $0.7100/1, 10:02 3.9K:400 $0.7100/1. The period ended on 10:04's 216 $0.71.
10:05-10:30 began a decline, after variable volume $0.7016/95 through 10:11 and after 10:05's 4.4K $0.71 (4.5K)/$0.7017 (500)/16 (400). B/a at 10:09 was 300:1.9K $0.7016/91. 10:12 began extremely low/no-volume $0.7050/1 through 10:21. B/a at 10:14 was 7.6K:1.1K $0.7050/1. 10:22's 9.2K $0.7050 ended that range and was followed by a drop on 10:23's 2K $0.7050/10 (300). That began extremely low/no-volume that led to a drop on 10:28's 369 $0.7010/00. B/a at 10:28 was 31:962 $0.7010/47, 10:29 39.7K:100 $0.7000/40 (offers rising). The period ended on 10:30's 200 70.
10:31-10:46 began variable-volume $0.7000/51 on 10:31's 200 $0.70. B/a at 10:32 was 38.8K:800 $0.7000/44, 10:33 41K:800 $0.7000/42. The period ended on 10:46's 200 $0.7000/51.
10:47-11:09 began with b/a at 10:47 of 1.9K:500 $0.7010/50 and began very low/no-volume $0.7000/10 on 10:47's 300 $0.7010. B/a at 11:02 was 34.5K:1.1K $0.7000/8. The period ended on 11:09's 306 $0.70.
11:10-12:35 did low-volume $0.70 after 11:10's 1.7K $0.7000/46 (1.5K)/00 and through 11:14. Then 11:15's 1.3K $0.7000/50 began mostly low/no-volume $0.7010/50. B/a at 11:20 was 7.2K:1.2K $0.7010/49 (offers falling), 11:32 28K:1.2K $0.7050/1. 11:35 began extremely low/no-volume $0.7050/1. B/a at 11:47 was 27K:1.4K $0.7000/1, 12:02 26K:1.5K $0.7050/1. Volume was interrupted by 12:10-:12's 8.7K $0.7050/1 (2.5K)/0. B/a at 12:14 was 21.9K:4.8K $0.70501. Volume began rising at 12:14 and by 12:21 was low/high-volume. B/a at 12:31 11.6K:5.1K $0.7050/1. The period ended on 12:35's 8.4K $0.7050/1.
12:36-13:24 did an initial drop on 12:36-38's 1.1K $0.7010 and then popped up on 12:39's 10.8K $0.7028/29/28/47 (2K)/10/49/51 (2.7K)/$0.7100 (1.7K)/$0.7101 and 12:43's 1.1K $0.7198. That began a very low-volume decline. B/a at 12:48 was 1.2K:1.2K $0.7150/99. 12:56's 1K hit $0.7111/15 and began very low-volume $0.7110/88, with falling highs. B/a at 13:01 was 500:1.9K $0.7110/87, 13:17 500:2.7K $0.7110/72. The period ended on 13:24's 300 $0.7110.
13:25-14:22 began very low-volume $0.7100/6, with slowly falling highs, after 13:25's 300 $0.7101/$0.7171 and 13:26's 400 $0.7101/70. B/a at 13:33 was 21.7K:200 $0.7100/67 (offers falling), 13:47 11.7K:1.4K $0.7100/8 (offers falling), 14:02 7.8K:1.4K $0.7100/2, 14:17 3.7K:1.4K $0.7100/1. The period ended on 14:22's 200 $0.71.
14:23-14:58 began extremely low-volume $0.7025/60 after 14:23's 19.4K $0.71 (20K incl 18K blk)/13 and 14:24-:26's 800 $0.7013/25. B/a at 14:27 was 6.7K:3.3K $0.7025/96, 14:32 6.1K:3.4K $0.7025/94, 14:47 4K:100 $0.7025/74 (offers falling). The period ended on 14:58's 400 $0.7025.
14:59-15:54 began medium-volume, just through 15:09, $0.7010/57, with falling highs, after 14:59's 500 $0.7025/18 (100), 15:00's 500 $0.7018/13/18/10, 15:01's 5.5K $0.7018/10/37 (1.7K)/60 (1K)/53/64 (1K)/18/10/18 and 15:02's 4.1K $0.7060 (3.9K)/18. B/a at 15:02 was 7.4K:2.8K $0.7010/60 (offers falling). Volume went low/medium-volume, mostly at $0.7010/11, beginning at 15:10. B/a at 15:11 was 5.8K:3.4K $0.7010/53, 15:32 900:3.1K $0.7011/55, 15:39 10.2K:200 $0.7010/59, 15:47 10.3K:2.3K $0.7010/57 (offers rising, setting up for a push into close?). The period ended on 15:54's 1.5K $0.701.
Note in the daily breakdown the buy percentage and VWAP movements in the following period - { setting up for a push into close } appears to have been correct. The thought occurred when seeing the above b/a movements beginning at 15:11 and prior to seeing the following period unfold.
15:15-16:00 began a wild high-volume, wide swings push into the close on 15:55's 2.5K $0.7010/54 (1K)/10 and 15:56's 2.5K $0.7010/11/10/53/10. 15:57's 50.9K, 11.89% of day's volume, did $0.7010/$0.75 and everything in between, b/a at 15:58 was 435:100 $0.7011/$0.7235, 15:58 did 20.6K, 4.81% of day's volume, $0.71/$0.7215, 15:59 did 1.5K $0.7011/$0.72 (100)/$0.7164 (100)/$0.7011, and the period and day ended on 16:00's 100 $0.7199 buy.
There were no AH trades.
Excluding the opening and closing trades (didn't qualify), there were 13 larger trades (>=5K & 1 4K+) totaling 105,132, 24.55% of day's volume, with a $0.7173 VWAP. For the trade volume the count seems reasonable and the percentage of day's volume seems fairly normal. The VWAP is interesting, being well above the day's $0.7106. This makes me think a lot of retail investors were buying (and MMs, shorters, ... and maybe DJ were selling, based on the buy percentage). Retailer buying seems supported by some stocktwits postings expressing buying based on $0.70 being perceived support and the usual price/volume watch list alerts. Ending Period Period Period __Per. Trade_ Period_ % Day_ Per. End
Period Volume Low High _Dollar Val._ VWAP___ Volume Buy ~%
10:04 59736 $0.7100 $0.7200 $42,426.26 $0.7102 13.95% 31.13% Incl 09:46 $0.7100 5,100 09:59 $0.7101 8,000
09:59 $0.7101 5,815
10:30 29465 $0.7000 $0.7100 $20,809.38 $0.7062 6.88% 31.09% Incl 10:22 $0.7050 4,900
10:46 25000 $0.7000 $0.7051 $17,542.70 $0.7017 5.84% 30.93% Incl 10:41 $0.7000 5,100
11:09 11210 $0.7000 $0.7010 $7,850.10 $0.7003 2.62% 28.10%
12:35 78190 $0.7000 $0.7051 $55,104.19 $0.7047 18.26% 29.68% Incl 11:17 $0.7050 6,000 12:32 5,000 12:33
12:35 $0.7051 6,100
13:24 26900 $0.7010 $0.7199 $19,096.27 $0.7099 6.28% 29.04%
14:22 36653 $0.7100 $0.7171 $26,027.75 $0.7101 8.56% 27.08% Incl 13:54 $0.7103 5,000
14:58 31729 $0.7013 $0.7100 $22,432.63 $0.7070 7.41% 24.90% Incl 14:23 $0.7100 17,990
15:54 48395 $0.7010 $0.7064 $34,010.10 $0.7028 11.30% 26.16%
16:00 77198 $0.7010 $0.7500 $56,321.93 $0.7296 18.03% 37.50% Incl 15:57 $0.7500 23,127 15:58 $0.7131 8,000
Notice the outsized effect the last six minutes had on buy percentage and VWAP. This should not be expected to repeat. Keep in mind that 16.7% of days volume occurred in just two minutes.
Buy percentage and VWAP were well connected most of the day. The semi-constant deterioration of the buy percentage through about 15:00 tells a story and I think the story was DJ was hitting the ATM.
We'll never know and it could be, as usual, shorters and MMs were a major factor.
On the traditional TA front, movements were: __Open_ ___Low_ __High_ _Close_ Volume_
Today 1.41% -1.41% 3.96% 0.26% 55.14%
Prior -4.04% 0.00% -4.45% -1.64% -9.49%
I would be leery of that high movement - look in the above break down at where it occurred and what the other periods had for their highs. Other than that, these conventional TA movements would be considered as positives suggesting near-term price strengthening as likely. Yesterday in this section I said ;i]{ ... and again offers the likelihood that we are approaching a bottom on this leg ... } and I iterated my "Not yet" thought.
With the touch of $0.70, my proposed support point, it may be time to re-consider.
On my minimal chart, yesterday I said { ... We have, in my mind anyway (and one day ahead of conventional TA folks), a confirmation of a break down. Fortunately it's on reducing volume, for now, and is not suggestive of a major drop (yet). } and went on to say { ... All this would let me stick with thinking we might find support at $0.70, the horizontal red line. I may change my mind as I get down below and/or as time passes. } Well, we got one day of support, but with a really odd intra-day behavior. We'll have to wait and see if we get a second day of continued support or not.
Based on the close, we did { ... find resistance at the medium-term rising orange line ... } and also did not { ... get through the short-term descending resistance (descending orange line) first, which may not be easy.
We continue "pushing" the lower experimental 13-period Bollinger band limit for the fourth consecutive day, not a good sign. Trading range was again completely, but today not far, below the falling mid-point, $0.7553.
Both the fast and slow EMAs continue to decline with the fast below the slow. The gap from the slow down to the fast is now $0.0267 (was $0.0271).
On my one-year chart, for the fourth consecutive day, trading range was completely below all SMAs but for that last six minutes that hit $0.75, all of which are falling with the 10-day below the 50-day SMA. The 20-day is still above the 50-day, but I think that won't last long.
Yesterday the oscillators I watch had improvement in accumulation/distribution, MFI (untrusted by me), and momentum. Weakening occurred in RSI, Williams %R, full stochastic and ADX-related. Williams %R and full stochastic were oversold and very near that were RSI and MFI (just exited oversold). Everything was below neutral.
Today had weakening in accumulation/distribution (and by an unusually large magnitude) and momentum. Improvement occurred in RSI (marginally), MFI (untrusted by me), Williams %R (still oversold), full stochastic (still oversold), and ADX-related.
The experimental 13-period Bollinger limits, $0.7044 and $0.8063 ($0.7116 and $0.8091 yesterday), stopped converging as both limits declined, the lower faster than the upper. The mid-point is falling.
All in, the conventional stuff is rotating to a positive near-term prognostication. My intra-day breakdown's buy percentages and VWAP behavior are not supportive of that though. The $0.70 support behavior tomorrow will be a critical factor, along with the volume, which I suspect will weaken, unless there's a large price movement, based on what I saw in the intra-day behavior.
Near-term as usual, I lean toward my unconventional stuff as being more reliable. Based only on all the above, I'll go toward starting a consolidation with difficulty establishing a positive bias though. That would suggest a negative bias is likely.
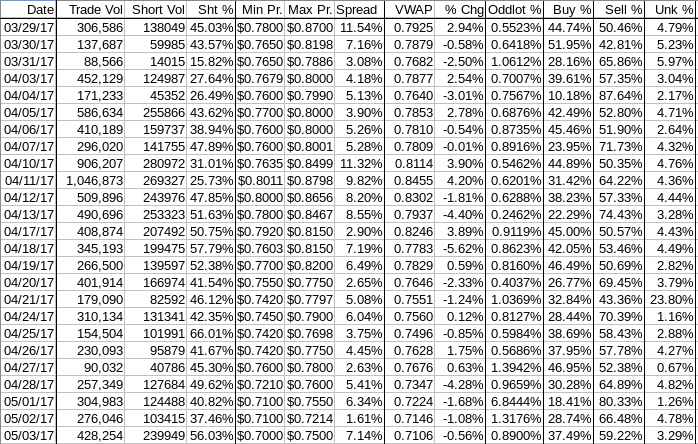
Percentages for daily short sales and buys moved in the same direction, generally good, but the short percentage went way above my desired range (needs re-check), not surprising considering the last six minutes of the day's trading. Note also that the buy percentage is likely a "bubble" that will pop tomorrow as the intra-day breakdown shows the buy percentage was weak all day until that last six minutes.
The spread was inflated by that last six minutes of trading. Without that it was only 2.86%, more consistent with consolidation. Adding in the weak buy percentage and the trends, likely consolidation with a weakening bias.
The VWAP's rolling average of the last twenty-four movements deteriorated from 14 negatives and 10 positives to 15 and 9 respectively. Change since 03/29 is -$0.0819, -10.34%, and the averages of the rolling 24-day period seen in the last few days (latest first) are now -0.4198%, -0.2739%, -0.1888%, -0.1311%, 0.1088%, 0.0842%, -0.2035%, -0.1687%, -0.0279%, and 0.1106%.
All in, the short percentage and (deflated) buy percentage and spread, combined with trends lead me to more near-term weakness as most likely, although consolidation is not out of the question. I consider that latter outcome as unlikely for the moment.
Bill
 News
News  Market Data
  Discover


