


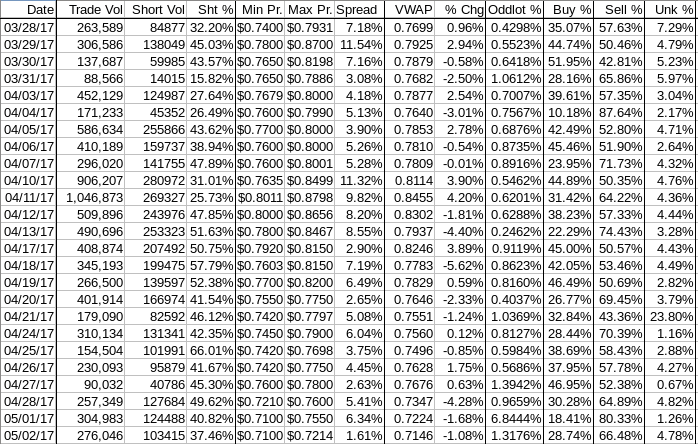
Wednesday, May 03, 2017 8:20:27 AM
Signs are that we are finally nearing the end of this down leg and it's starting to look like near-term consolidation with a weakening bias rather than "continued leg down". I do believe we will test the $0.70 support. I do not have a strong feeling about whether it will hold at this time. There are still indications that make me think the ATM may be in use, but maybe that's just paranoia (acquired through long physical and mental contact with my TFH).
Just because you're paranoid doesn't mean they're not out to get you ... or more likely your money.
Let's hope we don't get another PR tomorrow - maybe then price can hold up.
Today's trading was predominantly a narrow, very low-volume, sideways movement with the usual one to few-minute perturbations in price and volume.
There were no pre-market trades.
09:30-09:51 opened the day with a 1,900 sell for $0.71 & $0.71 x 4.4K in 5 trades. B/a just after open was 28.2K:271 $0.71/$0.7214. Then came 9:31's 3.9K $0.71, 9:32's 300 $0.71, 9:33's 400 $0.71, 9:34's 300 $0.71, 9:35's 300 $0.71, 9:36's 4.1K $0.7100/57 (100)/$0.72 (3.8K), 9:37's 2.1K $0.72, 9:38's 600 $0.72, 9:39's b/a 3.4K:2.4K $0.7200/13, 9:39's 400 $0.7200/7, 9:40's 200 $0.72, 9:41's b/a 3K:800 $0.7200/12, 9:41's 300 $0.72, 9:42's 1.1K $0.72, 9:43's 300 $0.72, 9:44's b/a 1.3K:1.1K $0.7200/12, 9:44's 800 $0.72, 9:45's 200 $0.72, 9:46's 300 $0.72/$0.7102 (100), 9:47's 700 $0.71/2/1, 9:48's 200 $0.71, 9:49's 200 $0.71, 9:50's 1.2K $0.7100/29 (893)/00, 9:51's b/a 25.1K:1.5K $0.7100/98 (offers falling). The period ended on 9:51's 24.1K $0.7100/49 (2K)/00 (30K incl 11K blk).
09:52-10:37 began extremely low/no-volume $0.7100/38, with highs falling to $0.7110 by 10:12 and $0.7101 at 10:19, on 9:52's 200 $0.71. B/a at 9:55 was 23.5K:4K $0.7100/81. Volume was interrupted by 10:07's 4.3K $0.7100/10 and 10:11's 4.1K $0.7100/15. B/a at 10:17 was 23K:800 $0.7100/1. At 10:29 range moved to $0.7105/10. B/a at 10:32 was 1.2K:271 $0.7110/$0.7214. The period ended on 10:37's 200 $0.7110.
10:38-11:11 began extremely low/no-volume $0.7110/28 on 10:38's 14K $0.7110/62/14 (11.3K & 2K blks)/12. B/a at 10:41 was 277:371 $0.7110/14, 10:47 277:371 $0.7110/14. Pecking the bid with 100/200 share minutes were predominant 10:57-11:11. B/a at 11:02 was 277:451 $0.7110/14. The period ended on 11:11's 200 $0.7110.
11:12-12:44 began a rapid rise doing 11:12's 400 $0.7161/10/61, 11:13's 4.8K $0.7200/06/00/06/00, 11:14's 5.5K $0.72/$0.7159/$0.72/$0.7105, 11:15's 2K $0.7126/5/7, 11:16's 3.9K $0.7127/8/50/35/44, 11:17's 400 $0.7128 and 11:20's 2.5K $0.7134/43/44/43/57/43/57/43. B/a at 11:19 was 200:500 $0.7125/44 (offers falling). 11:20 did 2.5K $0.7134/43/44/43/57/43/57/43. 11:20 switched to extremely low/no-volume $0.7133/51, with rising lows. B/a at 11:22 was 200:1K $0.7125/50, 11:32 800:1.2K $0.7151/$0.7208, 11:47 100:1.2K $0.7140/85. 11:49's 5.8K hit $0.7150/79 and 11:52's 500 hit $0.718/9. B/a at 12:03 was 400:3.9K $0.7200/10. 12:04's 1K hit $0.7199/$0.72. B/a at 12:11 was 200:200 $0.7198/9. 12:12's 5.3K hit $0.7199/$0.7210. B/a at 12:17 was 2.1K:452 $0.7200/12. 12:19's 200 hit $0.7212. B/a at 12:32 was 6.9K:245 $0.7200/12 (offers falling). Volume was interrupted by 12:36-:37's 18.3K $0.7211 (3.3K) and $0.7206 (1K)/00 (1.9K)/06/00 (11.6K). The period ended on 12:44's 100 $0.72.
12:45-13:18 began extremely low/no-volume $0.7150/6 on 12:45's 5.3K $0.7200 (2.5K)/$0.7198 (2.6K these two really one trade)/90/50. B/a at 12:47 was 4.7K:1K $0.7150/$0.7210. Pecking the $0.7150 bid with 100/200 share minutes were the only trades 12:53-13:18, interrupted by 13:10's 1.2K that hit the $0.7150 bid and 13:17's 3.3K $0.7150 (100)/$0.7151 (3.2K). B/a at 13:07 was 2.5K:1.2K $0.7150/95, 13:17 200:1K $0.7150/56. The period ended on 13:18's 200 $0.715.
13:19-13:51 began extremely low/no-volume $0.7120/39 on 13:19's 100 $0.7145. Pecking the $0.7120 bid with 100/200 share minutes were the only trades 13:20-:21 and 13:28-13:51. B/a at 13:23 was 3.6K:3.4K $0.7120/$0.7207, 13:32 3.1K:2.2K $0.7120/$0.7200, 13:47 1.5K:3.4K $0.7120/89. The period ended on 13:51's 100 $0.7120.
13:52-14:58 began rising on extremely low/no-volume, after 13:52's 15.1K $0.7120/12/05 (13.15K blk)/10, 13:54's 2.1K $0.7110/06 (2K) and 13:57's 6.1K $0.7105/64 (6K). B/a at 13:58 was 900:1K $0.7110/86, 14:03 3.9K:2.8K $0.7120/81. Volume picked up and 14:08's 3.3K hit $0.7180 (1K)/79/80 (2K)/79 and then 14:09's 3.4K $0.7120/51/50/71/79/81/75/20 dropped trading back down and began doing low and medium-volume $0.7120/79, with slowly rising lows and falling highs. B/a at 14:17 was 2.2K:1.3K $0.7121/81, 14:42 1.8K:2.8K $0.7121/72. Volume was interrupted by 14:49-:53's 12.5K $0.7121/20/30/20/43/33/38/33/41/33/40/33. B/a at 14:58 was 400:245 $0.7150/$0.7212. The period ended on 14:58's 1.5K $0.7120/25/27/28/33.
14:59-16:00, after two no-trades minutes, tried to begin the typical extremelylow/no-volume push higher on 15:01's 100 $0.7180 but the rise failed to stick as 15:06-:08 dropped trading back to extremely low/no-volume $0.7105/58. B/a at 15:02 was 300:3.7K $0.7150/$0.7211. 15:04's 1.1K hit $0.72. B/a at 15:19 was 85:1.8K $0.7125/58 (bids backed by presented 4.1K $0.7105), 15:34 185:1.2K $0.7125/79, 15:47 85:2.3K $0.7125/76 (bids backed by presented 4.1K $0.7105), 15:51 4.1K:2.1K $0.7105/74, 15:58 1.9K:500 $0.7106/68. The period ended on 15:59's 3.8K $0.7106/69 (1.6K)/37/10/50 (1.1K), 78/80 and the official close was the last 15:59 trade, $0.7180 because the MM 16:00 trade was an odd-lot 77 shares at $0.7106 and those sorts are not allowed to be official OLHC.
There were no AH trades.
Excluding the opening and closing trades (didn't qualify), there were 7 larger trades (>=5K) totaling 62,516, 22.65% of day's volume, with a $0.7144 VWAP. As with yesterday, the count seems a bit low for the day's volume and the percentage of day's volume also seem a bit low. The VWAP is well below the day's $$0.7214. Considering the volume and buy percentages behavior (see below) I'm thinking only shorters and MMs doing covering buys would be buyers here, although certainly some TA-based short-term traders are certainly a possibility too. Since our intra-day behavior was predominantly a sideways narrow range (spread of $0.0114) at a low price it presented a good opportunity for those doing covering buys and little opportunity for short-term traders.
Generally, there's reasonably decent correlation between movements in buy percentage and VWAP. As has been the case recently, the buy percentage is extremely low and it appears we have heavy selling. It's harder to conclude there was again ATM use because unlike yesterday we didn't have a day continuously dropping as if price made no difference. Shorters and MMs don't just do covering buys - they could also be shorting today to make some money.Ending Period Period Period __Per. Trade_ Period_ % Day_ Per. End
Period Volume Low High _Dollar Val._ VWAP___ Volume Buy ~%
09:51 48342 $0.7100 $0.7207 $34,441.49 $0.7125 17.51% 5.43% incl 09:51 $0.7100 7,000 10,766
10:37 23800 $0.7100 $0.7138 $16,914.40 $0.7107 8.62% 10.62%
11:11 30496 $0.7110 $0.7214 $21,839.67 $0.7161 11.05% 21.69% Incl 10:38 $0.7214 11,300 10:51 $0.7111 5,000
12:44 61059 $0.7105 $0.7212 $43,862.06 $0.7184 22.12% 26.91% Incl 12:37 $0.7200 9,300
13:18 14600 $0.7150 $0.7200 $10,465.15 $0.7168 5.29% 24.85%
13:51 5500 $0.7120 $0.7145 $3,919.14 $0.7126 1.99% 25.16%
14:58 60155 $0.7105 $0.7183 $42,917.56 $0.7134 21.79% 29.15% Incl 13:52 $0.7105 13,150 13:57 $0.7164 6,000
16:00 28504 $0.7105 $0.7200 $20,330.83 $0.7133 10.33% 28.73%
On the traditional TA front, movements were:
The only hopeful signs here are the flat low and volume, which has finally started to decline a bit. This is a follow-on from yesterday's declining rate of volume increase and again offers the likelihood that we are approaching a bottom on this leg. Yesterday, in the "All in" summary, I said { Not yet I think. } Considering only the stuff through here, I'm still of that mind.__Open_ ___Low_ __High_ _Close_ Volume_
Today -4.04% 0.00% -4.45% -1.64% -9.49%
Prior -2.39% -1.53% -0.66% 0.00% 18.51%
On my minimal chart, yesterday I said { ... yesterday trade range penetrated the medium-term rising support (rising orange line) and came back up to eventually close right on the line. Today it did the same but, as mentioned above, did so only because of the closing trade being up 2.38% from the prior range. For that reason I assess the close as manipulated and view the results as if it was a close below the line. This means that I think we actually have a break down and expect it will confirm tomorrow. }
Sometimes I curse my TFH and other times I laud it's prescience. Today it's the latter. Not only did we close below the rising medium-term support, the whole day's trade range was below that support. We have, in my mind anyway (and one day ahead of conventional TA folks), a confirmation of a break down. Fortunately it's on reducing volume, for now, and is not suggestive of a major drop (yet).
I also said { This means we should be looking to see the $0.70 price support (horizontal red line) challenged too. Having said that, if today was a result of ATM use and that doesn't occur tomorrow, we could see price range hold around where it is now. This is also suggested by the reducing rate of trade volume increase. }
All this would let me stick with thinking we might find support at $0.70, the horizontal red line. I may change my mind as I get down below and/or as time passes.
Any attempt to rise will now theoretically find resistance at the medium-term rising orange line because it is now supposed to be resistance. It is rising though so depending on when we take a run at it we might have a fair amount of headroom before we encounter it. Of course we will have to get through the short-term descending resistance (descending orange line) first, which may not be easy.
We continue "pushing" the lower experimental 13-period Bollinger band limit for the third consecutive day, not a good sign. Trading range was again completely, and far, below the falling mid-point.
Both the fast and slow EMAs continue to decline with the fast below the slow. The gap from the slow down to the fast is now $0.0271 (was $0.0229).
On my one-year chart, for the third consecutive day, trading range was completely below all SMAs, all of which are falling with the 10-day below the 50-day SMA. The 20-day is still above the 50-day, but I think it won't last long sans a large bump up in trading range.
As before, we are in a behavioral pattern that makes projection of coming SMA behavior seem useless.
Yesterday the oscillators I watch had weakening in accumulation/distribution, MFI (untrusted by me), full stochastic (which had been rising), and ADX-related. Improvement occurred in momentum and Williams %R and RSI was flat. Everything was below neutral, MFI and Williams %R were in oversold.
Today had improvement in accumulation/distribution, MFI (untrusted by me), and momentum. Weakening occurred in RSI, Williams %R, full stochastic and ADX-related. Williams %R and full stochastic are oversold and very near that are RSI and MFI (just exited oversold). Everything is below neutral.
The experimental 13-period Bollinger limits, $0.7116 and $0.8091 ($0.7176 and $0.8181 yesterday), continued converging as both limits declined, the upper faster than the lower. The mid-point is falling.
All in, yesterday I said { everything continues to offer no positive indications and present many negative indications, along with a still-rising volume. This latter item had a reduced rate of rise, offering a hope that the fall is nearing an end. Not yet I think. } This proved out today as only the low in the OLHC readings managed to hold flat as the others weakened substantially. The volume also declined for the second day, bring us nearer to where we ought to see a stop in the descent. However, the volume is still relatively high, being above the 10-day 247K average so it appears we have a bit to go yet.
That makes sense if we believe that the recent break down below rising support and the apparent pressure from two descending resistances (short-term descending orange line and the medium-term triangles descending red line) ought to at least go test the $0.70 support (horizontal red line) before reversing.
Anyway, the still-weak buy percentages, generally sideways intra-day behavior, oscillators going mixed but with the most important items still weak(ening), volume not having hit a level that suggests to me we bottomed, pushing the lower Bollinger limit, and two descending resistance lines lead me to feel near-term weakness is most likely, but likely looking more like consolidation with a mild weakening bias. This makes sense since we are in a medium-term consolidation (triangle) with a potential support just below.
Percentages for daily short sales and buys moved in opposite directions, not desirable, but the short percentage moved to just inside my desired range (needs re-check). Unfortunately, combined with a very low buy percentage, that means that that either a lot of inter/intra-broker trades were done (not suggested by the larger trades though, but that's not a reliable indication as smaller trades can and do occur intra-broker) or someone that already had shares in their control was selling to the market.
MMs generally get only short-term long but could be the culprits as the last several days have offered plenty of opportunities to short at the higher prices and then cover at lower prices. This means shares backing the sell orders they processed would let them get short-term long and could be one of the reasons we see the usual early higher prices - MMs dumping those shares.
If it's not the MMs I would guess it's DJ hitting the ATM.
The spread moved into consolidation territory, quite solidly too. This suggests that we should soon see the end of this down leg, likely after challenging the $0.70 support. The spread today would offer no clue as to whether that support would hold nor if we might see a reversal though.
The VWAP's rolling average of the last twenty-four movements, after holding steady for only two consecutive days at 13 negatives and 11 positives, deteriorated to 14 and 10 respectively. Change since 03/28 is -$0.0553, -7.18%, and the averages of the rolling 24-day period seen in the last few days (latest first) are now -0.2739%, -0.1888%, -0.1311%, 0.1088%, 0.0842%, -0.2035%, -0.1687%, -0.0279%, 0.1106%, and 0.3283%.
All in, the continued normal range of the recent short percentages (don't forget some were likely "masked" by larger inter/intra-broker trades), caveats above notwithstanding, and spread offer real hope the down leg is very near ending. The buy percentage is still a real issue and suggests there's still a lot of selling pressure though.
Trying to juggle all that into something meaningful I settle into near-term consolidation with a mild weakening bias. By now I know it's trite, but it's the best I can do.
Bill
Join the InvestorsHub Community
Register for free to join our community of investors and share your ideas. You will also get access to streaming quotes, interactive charts, trades, portfolio, live options flow and more tools.

