Revisit to Natural Gas (UNG) - New IT BUY Signal and Using Gaps to Set Stops By Erin Heim
* December 6, 2016
I recently received a tweet (follow me on Twitter @_DecisionPoint) thanking me for an updated chart of UNG on November 21st which helped him bag a 20% gain. Back in late October, I wrote an article on Natural Gas (UNG) discussing a possible bull market move to $12 if it broke out above $9.50. It broke out, but immediately dropped back below and triggered my stop. Chalking it up to false signals, I hadn't revisited the chart since Halloween. However, my readers of course did when they read the article in the archives, hence the follow-up question sent on Twitter.
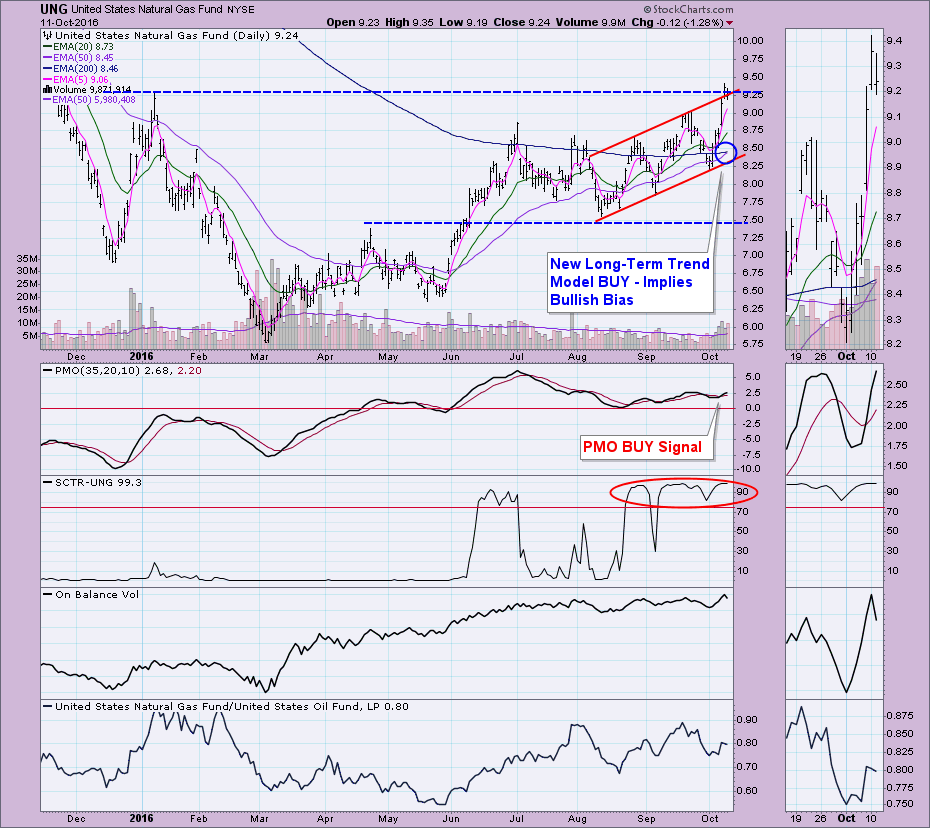
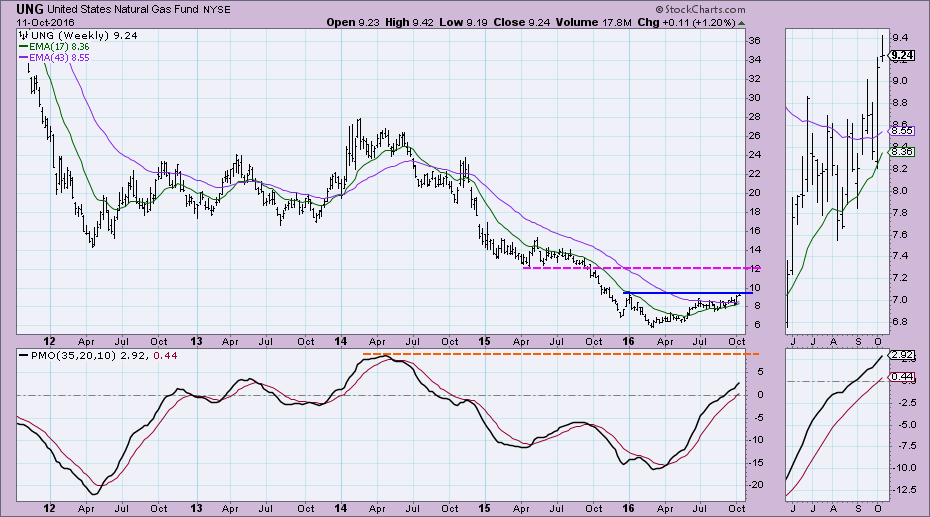
Here are the original daily and weekly charts I posted in the October article. Looked like a good set-up on the daily and weekly charts.
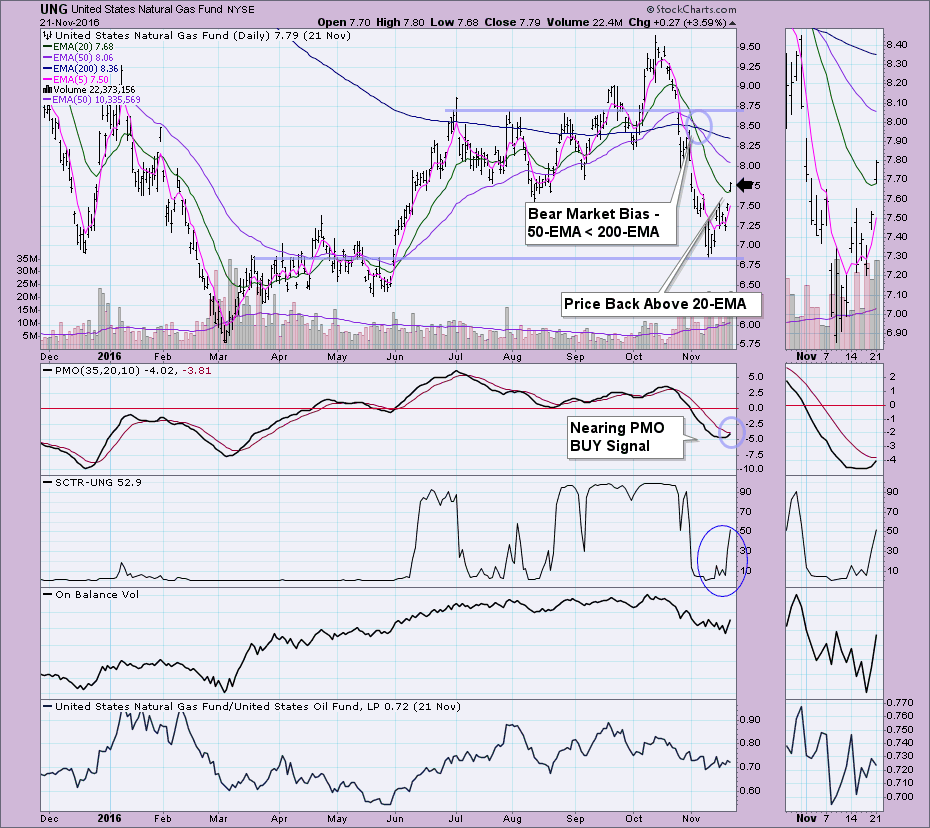
Looking at the chart on November 21st (shown below), I was shocked at the large correction that occurred after the stop was triggered on the bull trap. Stops are your friend... generally a very good friend if set properly. I cannot tell you how many times they have saved my bacon. I decided to update my annotations given the large decline and tweet it to my reader for review. My response with this chart, "Short-Term Bullish". The gap up (a possible breakaway gap) and price closing above the 20-EMA for the first time since the October top were compelling along with the PMO, OBV and SCTR configurations. Of concern was the bear market bias, hence the need for confirmation and a somewhat tight stop.
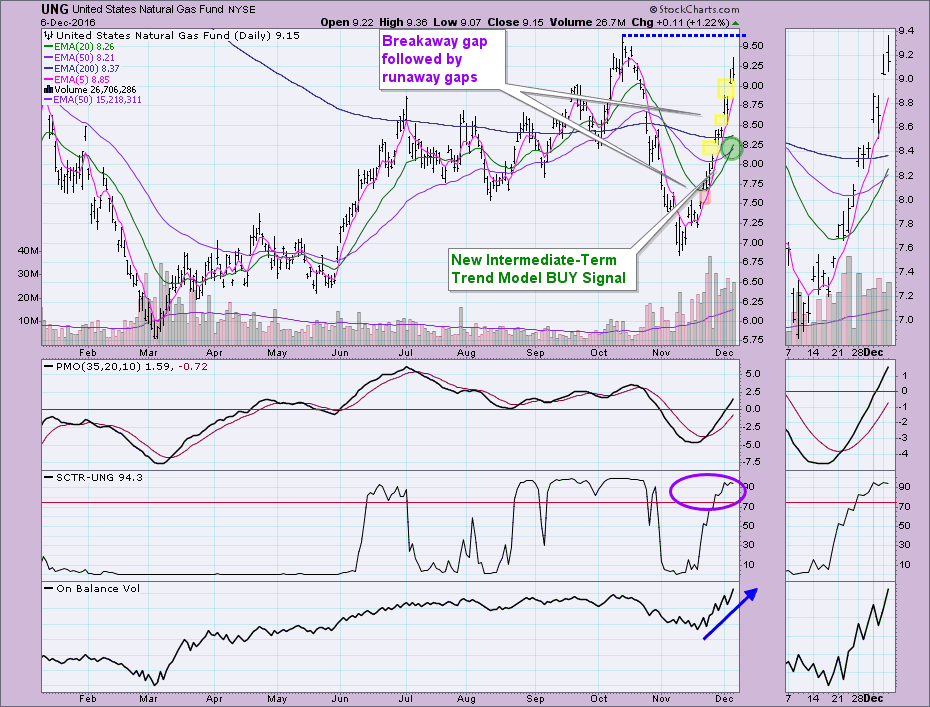
Here is the daily chart today. We've seen strong follow-through on the Price Momentum Oscillator (PMO) BUY signal. Today the 20-EMA crossed above the 50-EMA, initiating an Intermediate-Term Trend Model (ITTM) BUY signal. The OBV, PMO and SCTR all give us bullish confirmation. Just like in October, overhead resistance is the key. It needs to be broken and stay above the level. To prevent a loss like the one that could've been incurred back in October, a stop should be set.
If there are more gaps you should treat them as possible exhaustion gaps by placing a stop right where that gap would be closed. Exhaustion gaps are best seen after the fact..not particularly helpful, but we know they close rather quickly if they are indeed exhaustion gaps. If you had acted as though each of the runaway gaps were a possible exhaustion gap, your stop would have risen nicely with each successive gap and continues to protect you (and your gains).
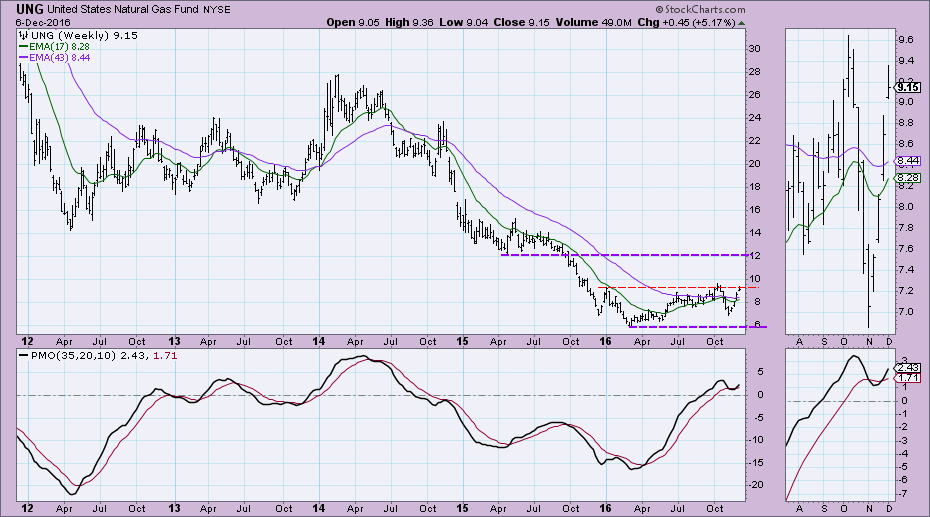
The current weekly chart suggests that $12.00 is a good projection. A break above $12 would be fabulous, but even a ride up there would be nice without a breakout. The key is setting proper stops.
Conclusion: UNG has bullish prospects, but a confirming breakout above overhead resistance at the October high is needed. Even with that, we just saw a bull trap. Using the gaps, consider placing a stop at the point where the most recent gap will be closed. If there are no gaps, look for a previous minor top and set it below that (or wherever your risk tolerance suggests). With low priced ETFs or stocks, we are particularly vulnerable to price shocks. Stops are a must.
Technical Analysis is a windsock, not a crystal ball.
 News
News  Market Data
  Discover