Commodities ETF (GSG) Posts New Long-Term Trend Model BUY Signal By Erin Heim
* December 29, 2016
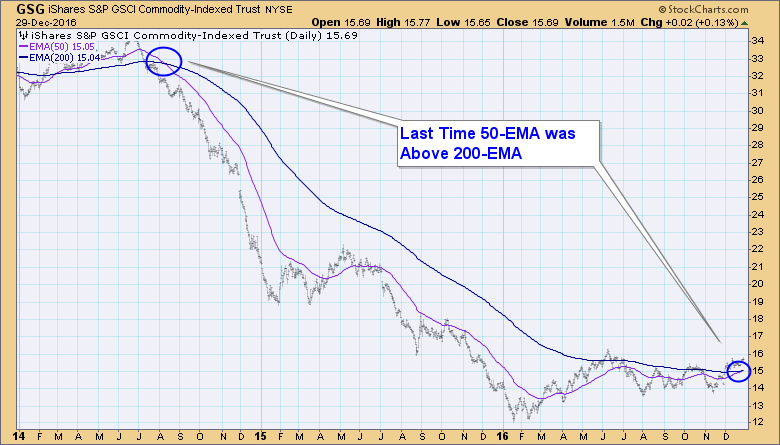
The iShares Commodity ETF (GSG) had a momentous BUY signal. Today, the 50-EMA crossed above the 200-EMA, reaching territory unseen since 2014. This crossover triggers a Long-Term Trend Model BUY signal that suggests GSG has entered a new bull market. A review of the charts reveals this new signal has arrived as GSG reaches a crossroad.
The significance of this Long-Term BUY signal is displayed in the long-term daily chart below. The DecisionPoint analysis philosophy tells us that GSG is entering a bull market (50-EMA > 200-EMA) after enduring a bear market (50-EMA < 200-EMA) of over two years.
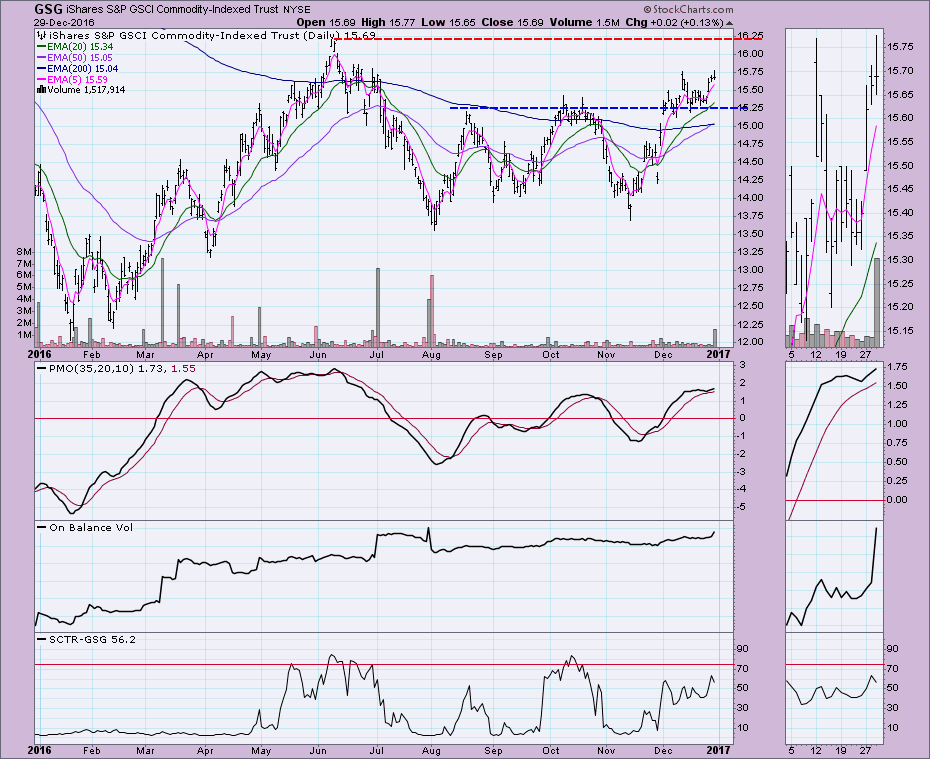
The daily chart shows GSG holding above support at $15.25. Unfortunately it hasn't been able to penetrate the $15.80 level. If it does I would look for a move to $16.25. The Price Momentum Oscillator (PMO) is in somewhat overbought territory, but it did avoid a crossover SELL signal. The SCTR is trending higher but hasn't reached the "hot" zone above 75.
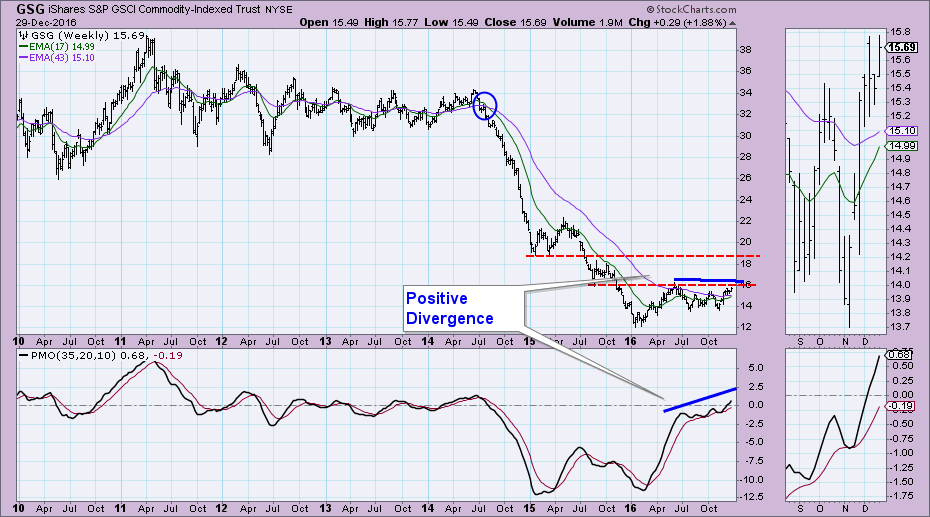
The weekly chart is very bullish. The 17-week EMA is just about ready to cross above the 43-week EMA for the first time since 2014. We can see the importance of the $16.25 resistance level. If it breaks out as the weekly PMO suggests, it has a clear path to $19.
Conclusion: The new Long-Term Trend Model BUY signal tells us that GSG has entered a new bull market. GSG has short-term potential should it be able to break above the $15.80 resistance level, for a move to $16.25. The weekly chart suggests that when the $16.25 level is broken and held, the next resistance level for price is $19.00. This may or may not happen this time around given the short-term PMO is getting overbought.
Technical Analysis is a windsock, not a crystal ball.
 News
News  Market Data
  Discover