Buy:sell, daily shorts & pps 10/25 2016 EOD
All in, best case is more consolidation without the weakening bias. But that "without" is only a weak possibility suggested by a volume rise sufficient, relative to recent trends, to suggest we may have bottomed. Unfortunately it's not high enough to preclude the possibility of increasing strength in a move lower.
Arguing against that latter scenario is that the conventional oscillators I watch that have oversold demarcations are oversold except that full stochastic is barely above it. This condition often results in a reversal.
I'm going agnostic for the moment - no reason I see to believe either flat or down is more likely and no reason to believe up is more likely yet.
Trading began with a $1.07 open and immediately went flat very low/no-volume $1.06/7 through 10:51 with buy percentage in the tank the whole time, ending at 16.39%. The range stepped down to $1.05/06 and went mostly very low/no-volume flat $1.05/6 through 13:01 and the buy percentage immediately recovered to 31.42% at 11:00. Most trades, although maybe not volume, from 11:55 on were >= $1.055 and buy percentage managed to get to 35.48% at 12:15 and by the period end hit 39.43%. 13:02-15:04 stepped back up to the $1.06/7 range and did extremely low/no-volume $1.06/7 and the buy percentage began weakening again hitting 37.93% at end of that period. As before, the next move was a drop to the prior range and began initially low/no-volume $1.05/6 which later became very low/no-volume. Buy percentage began trying to recover some but could only make 39.55% at 15:45 and ended the day at 38.31%.
There were no pre-market trades.
09:30-10:51 opened the day with a 1,642 sell for $1.07 & 300 more $1.07. Then came 9:31's b/a of 6.5K:86 $1.06/7 ($1.07's 86 offer backed by 5.7K $1.08), 9:36's 250 $1.07, 9:40's b/a 12.9K:1.6K $1.06/7, 9:39's ~2.5K $1.0700/1, 9:40's 9.9K $1.06, 9:41's 2.5K $1.07 (200)/$1.06, 9:42's 500 $1.06, 9:43's b/a 6.3K:5.2K $1.06/7.
That began very low/no-volume $1.06/7 with a minimal amount of 100-share pecking the bids being the only trades in many minutes, unlike recent behavior. B/a at 9:50 was 6.4K:5.4K $1.06/7, 10:13 5.5K:12.5K $1.06/7, 10:18 15.5K:11.2K $1.06/7 (early "left coasties" arrive?). Volume was interrupted by 10:34-:44's 17.3K $1.06. B/a at 10:48 was 4K:12.7K $1.06/7. Trades were heavily biased to the bid later in the period and looked to my novice eye like heavy short selling. The period ended on 10:51's 3.3K $1.06.
10:52-13:01 dropped on 10:52's 22.9K $1.0600/50->$1.06->$1.05/6->$1.0500/50 and 10:53's 29.8K $1.0550/$1/05->$1.0550/$1.06->$1.5000/50->$1.06/7->$1.0500/50 and began very low/no-volume $1.05/6. B/a at 11:09 was 17.7K:5.5K $1.05/6. Volume was interrupted by 11:21's 14.6K $1.05/6. B/a at 11:27 was 15.5K:8.2K $1.05/6. Volume was again interrupted by 11:37's 7.8K $1.05/6 and 11:39's 6.4K $1.05. B/a at 11:49 was 12.2K:8K $1.05/6, 12:03 13.4K:4.9K $1.05/6. Volume was interrupted again at 12:12's 11.7K $1.05/6. B/a at 12:20 was 14.5K:4.4K $1.05/6, 12:35 14.1K:1.8K $1.05/6. Price and volume were interrupted by 12:37's 4.4K $1.590/$1.06->$1.07 (100)->$1.06->$1.0590->$1.0684. B/a at 12:40 was 14.1K:1.5K $1.05/6, 12:48 14.1K:1.9K $1.05/6. The period ended on 13:01's 500 $1.06.
13:02-15:04 began extremely low/no-volume $1.06/7 on 13:02's 875 1.06/7. Early behavior was lots of no-trades minutes interrupted by infrequent 100-share minutes that pecked the bid or the ask about equally. B/a at 13:05 was 3K:5.1K $1.06/7, 13:23 4.9K:6.9K $1.06/7, 13:35 4.4K:5.7K $1.06/7, 13:49 4.7K:6.2K $1.06/7. Volume was interrupted by 14:01's 5.4K $1.000/50. B/a at 14:03 was 4.4K:12.1K $1.06/7, 14:35 4.5K:15.9K $1.06/7, 15:06 6.1K:15.5K $1.05/6. The period ended on 15:04's 100 $1.06.
15:05-16:00, after one no-trades minute, dropped down to the prior range on 15:06's 37.3K $1.065->$1.06->$1.05/6->$1.06/7->$1.05/6->$1.0500/50->$1.0550/$1.06 to begin low-volume $1.05/6. B/a at 15:14 was 12.5K:9.2K $1.05/6, 15:25 14K:8.8K $1.05/6, 15:49 13.2K:6.6K $1.05/6, 15:55 12.3K:8.5K $1.05/6, 15:58 12.7K:5.9K $1.05/6. The period and day ended on 15:59's $1.0500/50->$1.06->$1.05->$1.06->$1.05 and 16:00's 162 $1.05.
There were no AH trades.
Excluding the opening and closing trades (didn't qualify), there were 11 larger trades (>=5K & 4 4K+) totaling 68,737, 18.35% of day's volume, with a $1.0576 VWAP. For the day's trade volume, the count and percentage seems a bit low. I'm guessing this is a result of what the intra-day buy percentage being weak all day indicated - mostly selling and MM churn and little demand to get get long. Ending Period Period Period __Per. Trade_ Period_ % Day_ Per. End
Period Volume Low High _Dollar Val._ VWAP___ Volume Buy ~%
10:51 58919 $1.0600 $1.0701 $62,579.44 $1.0621 15.73% 16.39% Incl 09:40 $1.0600 8,574
13:01 160205 $1.0500 $1.0700 $169,316.83 $1.0569 42.77% 39.33% Incl 10:52 $1.0600 10,000 10:53 $1.0600 4,000
10:53 $1.0600 5,413 11:21 $1.0500 8,000
12:25 $1.0531 4,000
15:04 36926 $1.0600 $1.0700 $39,276.02 $1.0636 9.86% 37.96% Incl 14:01 $1.0632 4,500 14:21 $1.0677 4,000
16:00 113374 $1.0500 $1.0700 $119,773.97 $1.0565 30.27% 38.28% Incl 15:07 $1.0600 5,007 15:49 $1.0500 10,000
15:59 $1.0600 5,243
The buy percentage and VWAP generally reflect what was seen intra-day - four long flat periods that moved up and down by a penny with little buying demand and, probably, some fair amount of shorting.
On the traditional TA front, movements were: __Open_ ___Low_ __High_ _Close_ Volume_
Today -1.83% -0.94% -1.83% -2.78% 44.62%
Prior 0.93% 0.00% -1.80% -1.82% 0.85%
The only possible good thing here is the volume, relative to recent trends, is very high, possibly indicating the bottom of this short-term consolidation if one believes this volume is not the sign of increasing strength in the downward move. Considering the short and buy percentage below we don't see support for the volume not indicating increasing strength in the downward move. Note though that the buy and short percentages have been doing a lot of flip-flopping while we essentially went sideways with a mild weakening bias.
On my minimal chart, just like yesterday, we are going sideways with a mild weakening bias, the experimental 13-period Bollinger limits are still diverging and the mid-point is weakening. Yesterday I said { I guess I could look at the volume and suspect we might have bottomed out here, seemingly supported by the low being flat today, but it's really too soon to make that determination. } Today is similar, but for the flat bottom, and I can't really see any way, sans supporting indications, to feel strongly that we have found the consolidation bottom.
On my one-year chart we got the "Death Cross" as the 50-day SMA, at $1.4285, crossed below the 200-day SMA's $1.4341. I see no way to move back above the 200 sans a catalyst sufficient to get price up into the $1.5x+ area for several weeks. The 10, 20, 50 and 200-day SMAs continue descending. All the SMAs should continue to drop barring a substantial near-term rise.
The oscillators I watch were all weakening, all still below neutral, and MFI (untrusted by me), RSI and Williams %R all oversold yesterday. Today only full stochastic is not oversold after it and all the other oscillators weakened again. All are below still neutral.
The experimental 13-period Bollinger limits, $0.9579 and $1.5129 ($0.9890 and $1.5433 yesterday) continue diverging, but barely, with a falling mid-point.
All in, everything but for the volume suggests continued consolidation with a weakening bias. The volume is a toss-up for the moment. It rose on a weakening day, suggesting possible increasing strength in the downward movement, but was large enough, relative to common recent volumes, to also suggest we had found a short-term bottom in this consolidation.
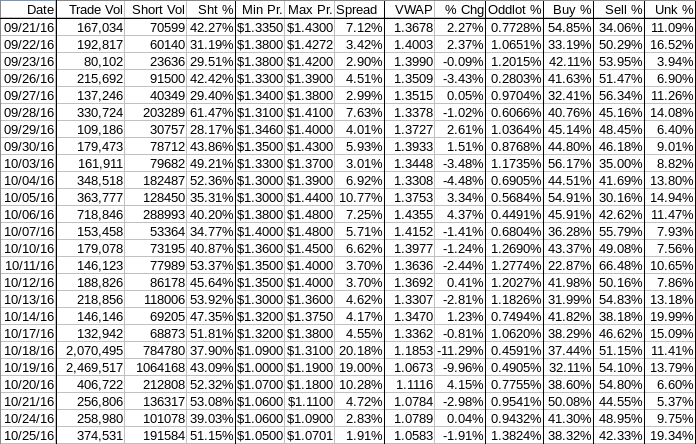
Percentages for daily short sales and buys moved in opposite directions, the short percentage went well above my desired range (needs re-check) and the buy percentage moved further below the range needed for appreciation and even below that needed to weakly hold current ranges with small price variations up and down.
The spread contracted again and continues to indicate consolidation and no big moves either way.
The VWAP's last twenty-four readings deteriorated from 13 negatives and 11 positives to 14 and 10 respectively. Change since 09/21 is -$0.3096, -22.63%, and the averages of the rolling 24-day period seen in the last few days (latest first) are now -0.9932%, -0.8187%, -0.8505%, -0.8923%, -1.0866%, -0.6859%, -0.2351%, -0.6179%, -0.8203%, and -0.6925%.
All in, looking as hard as I can, I see no positive indicator, with the possible exception of volume being sufficient to suggest we may have hit this consolidations bottom. But it's inconclusive and is not supported by other indications. I think consolidation is the best we can hope for and we have the possibility that the weakening will cease.
Bill
 News
News  Market Data
  Discover


