Plotting the Nasdaq 100 Breakout on an Intraday Point & Figure Chart By Arthur Hill
* September 9, 2015
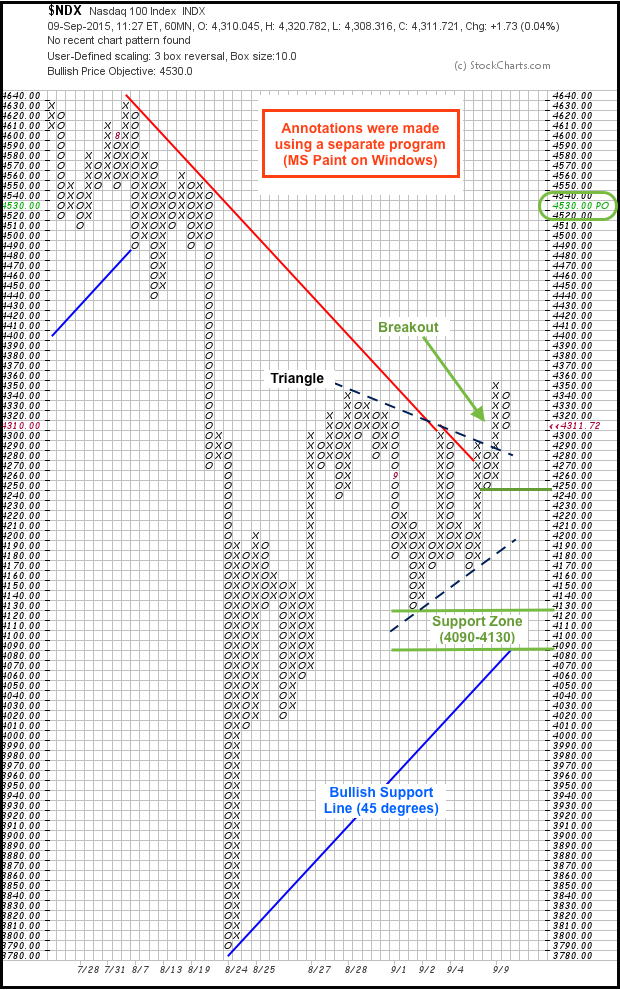
StockCharts users can create intraday P&F charts to shorten their time horizon and identify key levels to watch. The chart below is a 60-minute P&F chart with 10 points per box and a classic 3-box reversal. After plunging to 3790 in mid August, the Nasdaq 100 rebounded with a bounce back to the 4300 area in late August and then consolidated into September. A triangle formed over the next several days and the index broke out with a surge above 4300 this week. Notice that the index broke the red bearish resistance line, broke the triangle trend line and exceeded the late August highs. The bullish price objective confirms the bullish P&F signals and the upside price objective is 4530 (green oval).
This P&F chart also provides some key levels to watch going forward. The green line at 4250 marks the low of the last O-Column. A break below this column would trigger a basic P&F sell signal with a double bottom break down. Such a move would also suggest a failed breakout. Further down, the early September low and bullish support line mark a support zone in the 4090-4130 area. A move below 4190 would break the bullish support line and forge a lower low. Such breaks would clearly reverse the upswing and suggest they August decline was continuing.
 News
News  Market Data
  Discover