There is a moment that I love when analyzing markets using Hurst’s cyclic principles which is when all the pieces of the puzzle fit into place. It is an “Aha!” moment that removes analysis uncertainty, and suddenly we can see just a bit further into the misty future.
Such a moment happened for me when I realized that the October trough was an 18-month cycle trough (as discussed in this post). After that realization it was no surprise to see the market climbing so steeply. Of course the market has been bullish: it is bouncing out of an 18-month magnitude trough. The media is full of speculation about how long this bull market is going to last, and so I thought I’d throw in my two cents worth!
Of course the concept of “how long the bull is going to last” depends on your time-frame, but the bull market that everyone is discussing, and that I am writing about here is the move that started in March of 2009.
There is a wonderfully complex thought process that lies behind the Hurst Cycles logic that is used to answer this seemingly simple question. Complex but not difficult, it is bit like holding the many interlocking pieces of a jigsaw puzzle in your mind. If you get lost simply go back one step, and if that doesn’t work take a coffee break and start again!
First of all some fundamental ideas:
Cycle Shapes
We expect prices to trace out M-shaped moves at all degrees. Those M-shapes are distorted by the power of longer cycles because of the way in which multiple cycles combine, and sometimes they can be distorted so much that the full M-shape might not be clear, but there will always be an upwards move followed by a downwards move (what could be called an A-shape), even if it is very unbalanced.
Those M-shapes (or simple A-shapes) are bullish, bearish or neutral, as defined by two characteristics:
• The position of the peak in the cycle. If the peak is early, it implies a bearish shape, if it is late then the cycle is bullish. • And the relative positions of the troughs. This is more obvious: if the closing trough is higher than the trough at which the cycle starts then it is bullish, if it is lower then it is bearish!
The next thing to note about the shapes that cycles make in the market is that they tend to follow a sequence. That sequence goes like this: following the trough of a longer cycle than the cycle being considered, the first cycle is expected to be bullish. Then if the harmonic ratio with the longer cycle is 2 to 1 then the second cycle is expected to be bearish. If the harmonic ratio with the longer cycle is 3 to 1 then the second cycle is expected to be neutral (or less bullish) and the third cycle is expected to be bearish.
The reason I mention cycle shapes is that the answer to the question “how long is the bull market going to last?” is in the cycle shapes. The bull market we have witnessed over the past five and a half years has provided us with the framework to start considering the shape of the current 9-year cycle. This bull market will end when the peak in the 9-year cycle forms (as mentioned by John in this post).
Now this is how the puzzle logic works:
When will the top occur?
We need to consider when the 9-year peak is likely to be. That peak is already “late” in that it has occurred after the mid-point of the cycle. And so the peak of the 9-year cycle will also be the peak of the current 54-month cycle, which started in November 2012 (that could be debated, but for the purposes of today’s argument let’s accept that as the 54-month cycle trough).
And so when will the peak of the current 54-month cycle be? To answer that we need to consider what cycle shape we expect. As mentioned above, when the harmonic ratio with the longer cycle is 2:1 then we expect a bullish cycle followed by a bearish cycle. The harmonic ratio between the 54-month cycle and the 9-year cycle is 2:1 (9 years is double 54-months). And so the first 54-month cycle was expected to be bullish. It was, as shown here:
Calling that cycle bullish is an understatement, but the important thing is to stick to the definitions given above for whether a cycle is bullish or bearish.
Now following a bullish cycle we expect a bearish cycle (according to the sequence of cycle shapes described above). And so we expect the current 54-month cycle to have a bearish shape. And so when do we expect the peak of the current 54-month cycle? We expect it to occur early in the cycle, in either the first or the second 18-month cycle within that 54-month cycle. The new highs achieved recently rule out the possibility that the peak occurred in the first 18-month cycle, and so the peak of the 54-month cycle is expected to occur within the current 18-month cycle.
Now there is an important subtlety here – you might feel that the extended upwards move since November 2012 already feels “more bullish” than the 54-month cycle between March 2009 and November 2012. But remember that we are looking at cycle shapes here, not the overall level of the market. And we have only seen the first 18-month cycle of the current 54-month cycle, which was expected to be bullish, and does not mean that the full 54-month cycle cannot end up bearish.
And so our logical process tells us that the 9-year cycle peak is expected within this 18-month cycle. Can we go further than that? Yes indeed. When do we expect the peak in this 18-month cycle? The answer to that question of course lies in the cycle shape we expect.
What cycle shape do we expect? Neutral, or at any rate less bullish than the previous cycle shape. And that implies that we expect the peak of the cycle to occur near the mid-point of the cycle, or that we could expect to see a balanced double-peak form here (the M-shape). Which of those is more likely? Neutral cycle shapes almost always exhibit M-shapes as opposed to A-shapes, and so the double-peak option is more likely in my opinion.
Will they be equal peaks, or will one of them be higher than the other? Remember that the peak of the current 54-month cycle is expected to be early (because the cycle is expected to have a bearish shape), and so the odds favor the formation of the higher peak at the first of the two peaks that form the M-shape.
And there finally is the answer to our question: we expect the bull market to continue until about March 2015 (where the first peak of the 18-month cycle is likely to form). There will be another run up which will complete in about October 2015, but it is unlikely to exceed the earlier peak.
The great thing about using this approach to cycle shapes is that we can update and monitor our forecast as the cycle shapes unfold. For instance that March 2015 date might move earlier if we see any signs that the bull is weakening. Those signs will show up in the cycle shapes of the shorter cycles. The current shape of all cycles shorter than the 18-month cycle is looking bullish, as expected, but as the shorter cycles form we can detect any move towards bearishness, which will allow us to adjust our expectation for the end of the bull market.
This logic is all based on the sequence of cycle shapes in the market. How reliable is that?
Here is an analysis of the GBPUSD (British Pound vs United States Dollar) showing how the sequence of 18-month cycle shapes has played out as expected in the current 9-year cycle:
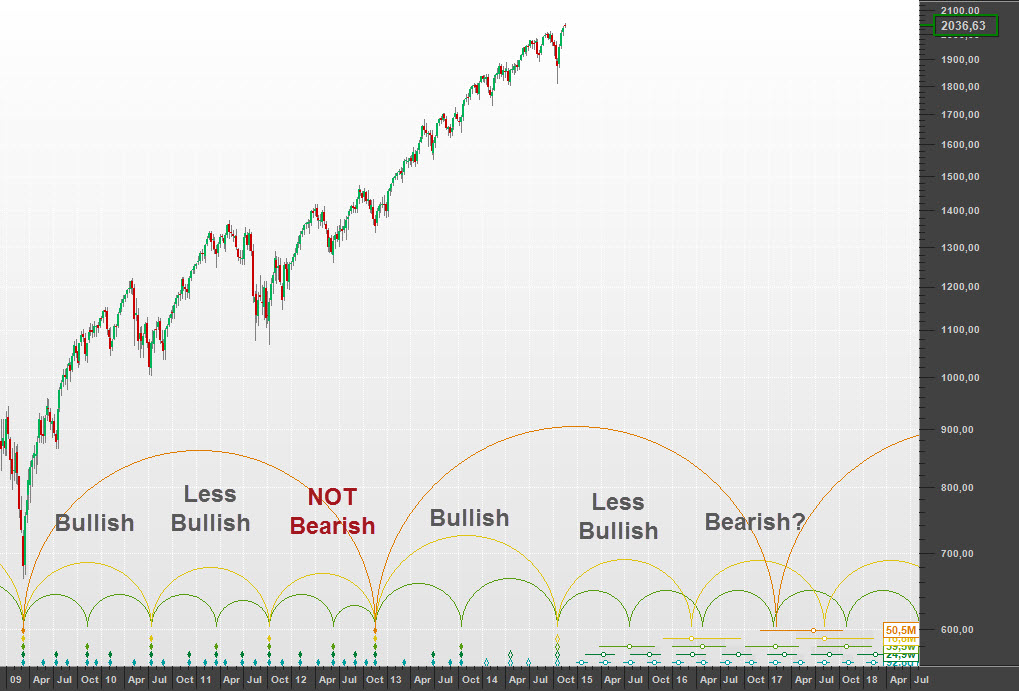
And here is that same period in the S&P 500:
Do you notice the anomaly? The 18-month cycle from October 2011 to November 2012 is not bearish. It is an inconsistency that has bothered me for almost three years.
It is either explained by accepting that the markets aren’t perfect, or by accepting that there is the harmonic echo of a six-year cycle at play (as discussed here), or perhaps this analysis is simply wrong!
 News
News  Market Data
  Discover