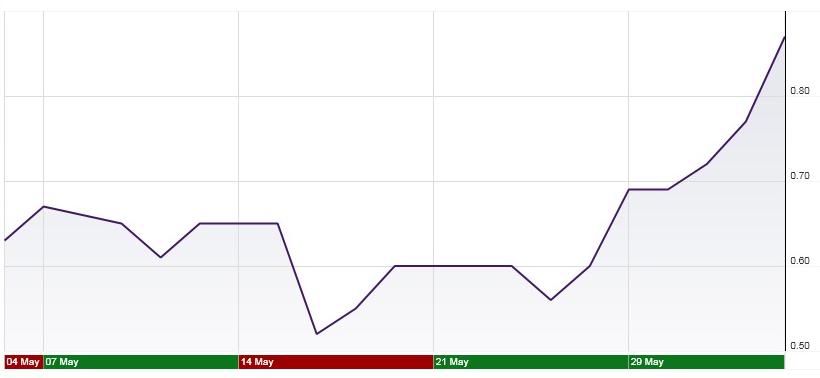
Includes: 1 month chart, 1 month accumulation/distribution, 1 month momentum, and 1 month on balance volume.
Charts created by and formulated by Scottrade.com
For those that don't know, the two main types of financial analysis on equities such as stock are fundamental and technical. Most people pick one, I use both. Bellow you will find technicals for INMG. 1) Chart: Chart shows up-trending PPS, clear and most basic sign of technical growth
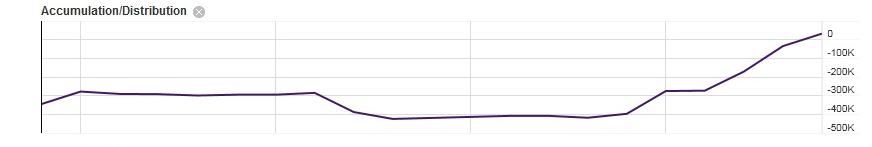
2) Accumulation/Distribution: Using a formula (Acc/Dist = ((Close – Low) – (High – Close)) / (High – Low) * Period's volume) Accumulation (buying) is also up-trending
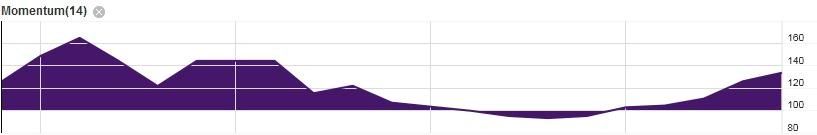
3) Momentum: Tracks acceleration of price and/or volume. Up-trending spike is seen
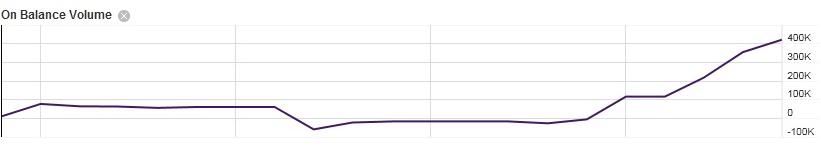
4) On Balance Volume: Technical indicator of cumulative volume based on price. Once again, up-trending Formula shown bellow (Source:Wikipedia)
Register for free to join our community of investors and share your ideas. You will also get access to streaming quotes, interactive charts, trades, portfolio, live options flow and more tools.
 News
News  Market Data
  Discover