


Wednesday, November 04, 2009 10:22:36 AM
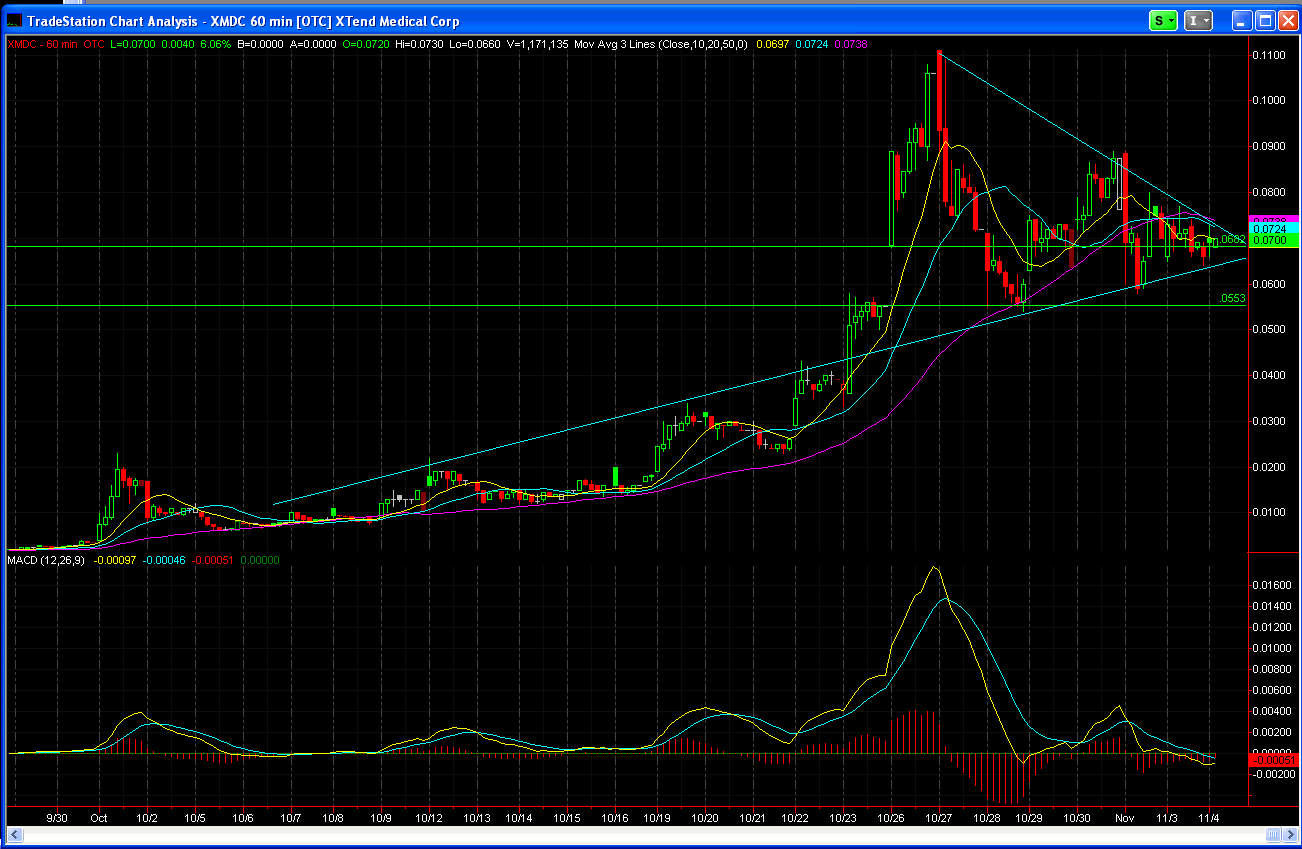
The Bullish Penant is forming nicely on the 60 minute (the baby blue lines forming a triangle in the chart). The PPS is following the trend perfectly. In the next day or so we should see if it breaks to the upside as we hope it does.

The lines are converging nicely as show on this next chart, with the PPS following them perfectly.

The next chart shows how the price is riding along the support bar (green) that is around the price of .068, or about 7 cents. Volume is very light. Any positive news would send the PPS sky rocketing, in my opinion. Very little selling, and it seems every dip is taken advantage of buy the buyers. Hopefully we shall see an explosion upwards in PPS soon. As I am typing this the stock is moving up nicely. Let's all hope she breaks out to the upside this morning.
Link to definition of Bull Pennant Pattern
http://www.thestockbandit.com/bull-pennant/
ZenaTech, Inc. (NASDAQ: ZENA) Launchs IQ Nano Drone for Commercial Indoor Use • HALO • Oct 10, 2024 8:09 AM
CBD Life Sciences Inc. (CBDL) Targets Alibaba as the Next Retail Giant for Wholesale Expansion of Top-Selling CBD Products • CBDL • Oct 10, 2024 8:00 AM
Foremost Lithium Announces Option Agreement with Denison on 10 Uranium Projects Spanning over 330,000 Acres in the Athabasca Basin, Saskatchewan • FAT • Oct 10, 2024 5:51 AM
Element79 Gold Corp. Reports Significant Progress in Community Relations and Development Efforts in Chachas, Peru • ELEM • Oct 9, 2024 10:30 AM
Unitronix Corp Launches Share Buyback Initiative • UTRX • Oct 9, 2024 9:10 AM
BASANITE INDUSTRIES, LLC RECEIVES U.S. PATENT FOR ITS BASAFLEX™ BASALT FIBER COMPOSITE REBAR AND METHOD OF MANUFACTURING • BASA • Oct 9, 2024 7:30 AM

