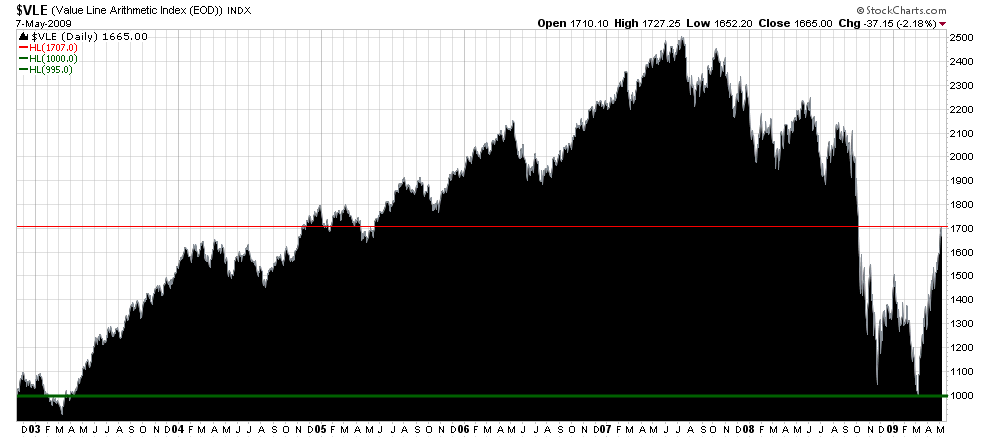
This 7-year chart shows the market after yesterday's pullback. Before taking long positions, I want to see this chart settle to 1500. On the way to 1500, I will examine the structure of the daily moving averages to see what I want to own--if anything.
Strip price to the barest data that tells us BUY, HOLD, or SELL.
Register for free to join our community of investors and share your ideas. You will also get access to streaming quotes, interactive charts, trades, portfolio, live options flow and more tools.
 News
News  Market Data
  Discover