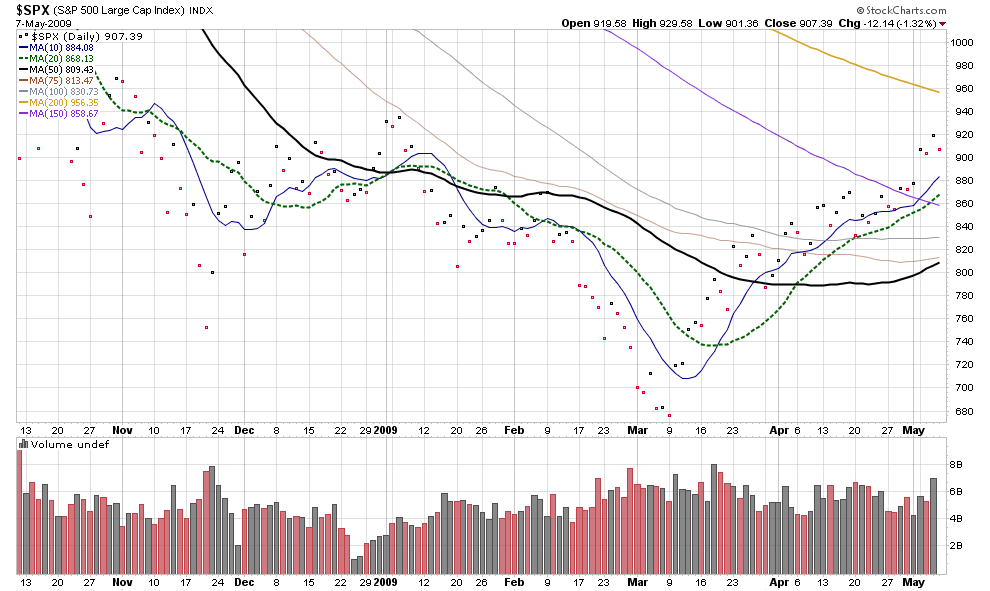
Let's look at the right-now of the market on a daily chart. ================================ Price (represented by a dot in this case) is above all the following moving averages: 10, 20, 50, 75, 100, and 150. All are pointing up or are turning up except the 150-day ma. Bullish. Automated message: HOLD. [Note: There may be good reasons to SELL here to collect profits. This is an area for continuous improvement. Not a major issue.]
The 150 is arcing up ever so slightly, being pulled by advancing price. Message: The long-term trend still down because the moving average is still pointing down. The slight upward arc is a bullish hint but not a signal to BUY, HOLD or SELL.
Price is below the 200-day ma, which is down-sloping but arcing slightly up, moved by advancing price. Message: The long-term trend still down because the line is pointing down and price is below the moving average. The slight upward arc is a bullish hint but not a signal to BUY, HOLD or SELL. ================================
The brain examines this chart (even the highly trained ones belonging to professional traders) and they imagine all kinds of unknowable future outcomes. And then based on these imagined futures, they make good decisions and lousy ones. This brings overall stats to under 70 percent.
My computer friend simply sees what is, and makes objective decisions based on the immutable law of price. Now sometimes the market gets choppy and barely worth trading. This is analyzable too--it's knowable. Because the moving average lines reveal the choppiness, it therefore can be automated. Our computer friend will just sit calmly and wait. Then it will strike like lightening when a clear signal fires. The computer never tires.
The tired human brain is the major source of trading error. It is what happened to me on Monday this week. I was tired from setting up this board and a bit distracted. Now one of those trades was a winner and the second may be a winner yet--we shall see. But I'm not happy with it even if it wins.
One more thing: For the last two months, I've been competing this method against the market calls of traders all over Investors Hub. I would look at my chart and get my read in a couple minutes, and then I would shake my head in disbelief at what other traders were saying--and the trades they were making against the flow of the market. That's when I decided I wanted to start publishing this information. It's time to end trading as a gambling endeavor--unless that is your personal choice--to throw money at the market just for the thrill of the possibilities.
Strip price to the barest data that tells us BUY, HOLD, or SELL.
Register for free to join our community of investors and share your ideas. You will also get access to streaming quotes, interactive charts, trades, portfolio, live options flow and more tools.
 News
News  Market Data
  Discover