


| Followers | 686 |
| Posts | 142814 |
| Boards Moderated | 35 |
| Alias Born | 03/10/2004 |
Friday, June 14, 2024 5:02:55 PM
By: Bruce Powers | June 14, 2024
• Gold consolidates at 2,345, facing resistance and potential bearish indicators, with key support levels crucial for maintaining the current uptrend price structure.
Gold further consolidated on Friday, testing resistance around the 50-Day MA, which is currently at 2,345. The 20-Day MA converged with the 50-Day line today and marks the same price area. A bearish sign will be indicated if the 20-Day line crosses below the 50-Day. Gold is sandwiched between the moving averages at the top and last week’s low of 2,287 at the bottom of a five-day price range.
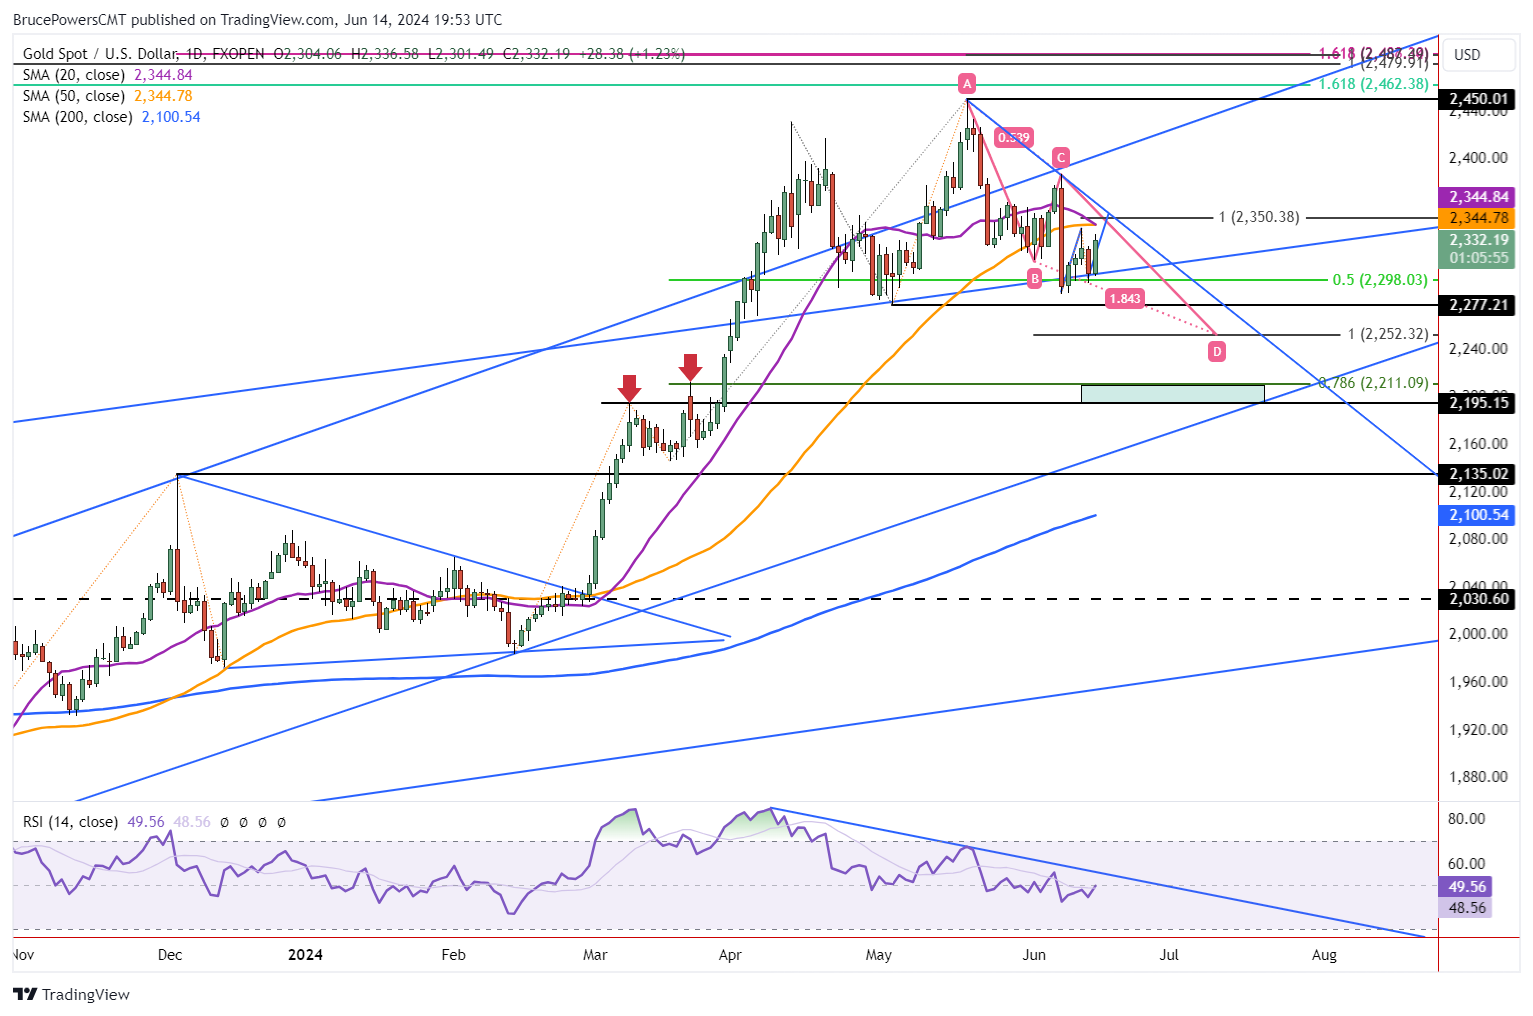
Resistance Zone from 2,345 to 2,350
Another price area to keep an eye on for resistance is a little above the 50-Day MA at 2,350. That price completes an initial target for a small rising ABCD pattern. And it is contained within last Friday’s wide price range, which by itself influences choppy price action. Last Friday’s high of 2,388 began with a bullish breakout but ended with a failed breakout and a bearish close. Therefore, given the current price patterns in gold, it looks like a decisive rally above 2,388 would be needed to sustain a bull reversal into new record highs. Otherwise, support remains at risk of being broken to the downside.
Weakness Likely Below 2,301
Weakness would next be indicated on a drop below today’s low of 2,301 and further confirmed on a decline below last week’s low of 2,287. Regardless, the recent swing low of 2,277 cannot be ignored. It defines the price structure of the uptrend and is a key price level to watch for support. If it is approached a third time it seems likely to give way to lower prices. Certainly, characteristics of the trend can change, but a drop below it would be considered bearish and provide a clearer sign that sellers were in charge.
Lower Pivots Start With 2,252
Downside pivots are at 2,252, 2,211, and 2,195. The lower price level takes on greater importance given its nearby neighbor, the uptrend line. Also, the trendline takes on greater significance since it would follow a successful test of resistance around the top line of a parallel trend channel most recently. Once price reverses from resistance in a chart pattern it tends to at least attempt if not reach the other side of the pattern. For gold that dynamic would be complete if it reaches the price area of the uptrend line.
Read Full Story »»»
 DiscoverGold
Information posted to this board is not meant to suggest any specific action, but to point out the technical signs that can help our readers make their own specific decisions. Caveat emptor!
• DiscoverGold
Recent GLD News
- Form 8-K - Current report • Edgar (US Regulatory) • 05/29/2024 06:46:50 PM
- Form 10-Q - Quarterly report [Sections 13 or 15(d)] • Edgar (US Regulatory) • 05/08/2024 06:11:30 PM
- Form 10-Q - Quarterly report [Sections 13 or 15(d)] • Edgar (US Regulatory) • 02/08/2024 03:33:22 PM
- Form FWP - Filing under Securities Act Rules 163/433 of free writing prospectuses • Edgar (US Regulatory) • 01/19/2024 05:18:16 PM
- Crypto: RNDR, LINK, CHZ Emerge as Wednesday’s Top Performers, Ethereum Pilots Dencun Update, and More • IH Market News • 01/17/2024 04:51:44 PM
- Form 424I - • Edgar (US Regulatory) • 12/27/2023 04:04:08 PM
- Form FWP - Filing under Securities Act Rules 163/433 of free writing prospectuses • Edgar (US Regulatory) • 12/22/2023 09:02:08 PM
- Form 10-K - Annual report [Section 13 and 15(d), not S-K Item 405] • Edgar (US Regulatory) • 11/22/2023 07:49:08 PM
- Form FWP - Filing under Securities Act Rules 163/433 of free writing prospectuses • Edgar (US Regulatory) • 09/14/2023 02:12:55 PM
- Form 8-K - Current report • Edgar (US Regulatory) • 09/12/2023 08:02:07 PM
- Gold Stabilizes Near One-Month Highs as U.S. Interest Rate Hike Expectations • IH Market News • 08/31/2023 12:43:38 PM
- Gold Closes Higher, With Strong Retreat In Treasury Interest Rates And Dollar Low • IH Market News • 08/29/2023 06:20:49 PM
- Form 10-Q - Quarterly report [Sections 13 or 15(d)] • Edgar (US Regulatory) • 08/07/2023 06:55:27 PM
Greenlite Ventures Completes Agreement with No Limit Technology • GRNL • Jul 19, 2024 10:00 AM
VAYK Expects Revenue from First Airbnb Property Starting from August • VAYK • Jul 18, 2024 9:00 AM
North Bay Resources Acquires Mt. Vernon Gold Mine, Sierra County, California, with Assays up to 4.8 oz. Au per Ton • NBRI • Jul 18, 2024 9:00 AM
Nightfood Holdings Signs Letter of Intent for All-Stock Acquisition of CarryOutSupplies.com • NGTF • Jul 17, 2024 1:00 PM
Kona Gold Beverages Reaches Out to Largest Debt Holder for Debt Purchase Negotiation • KGKG • Jul 17, 2024 9:00 AM
Avant Technologies Welcomes Back Former CEO with Eye Toward Future Growth and Expansion • AVAI • Jul 17, 2024 8:00 AM

