


Saturday, May 11, 2024 10:46:37 AM
Hopefully this will display, if not here is a link.
https://www.sec.gov/Archives/edgar/data/0001325964/000155335024000021/image_033.jpg
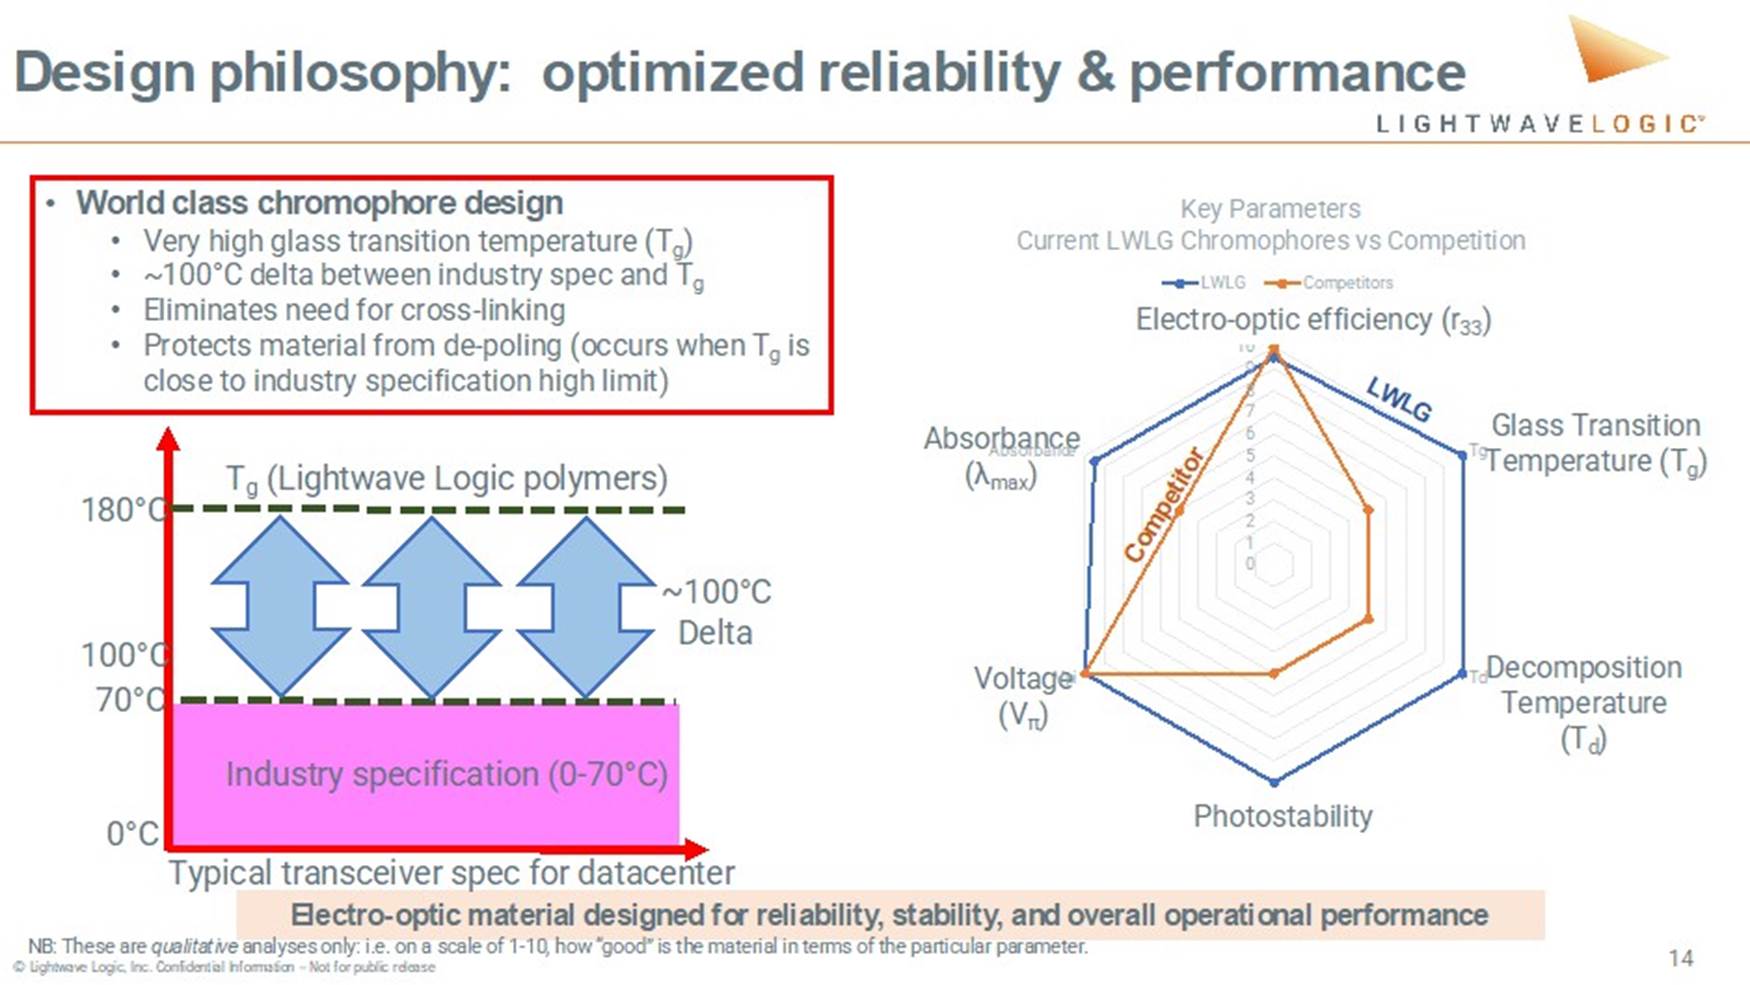
That spider chart has it going on baby Oh and for the cherry on top
Oh and that r33 looks to be north of 200 now which was a long-time goal in the way back machine.
https://www.sec.gov/Archives/edgar/data/0001325964/000155335024000021/image_034.jpg
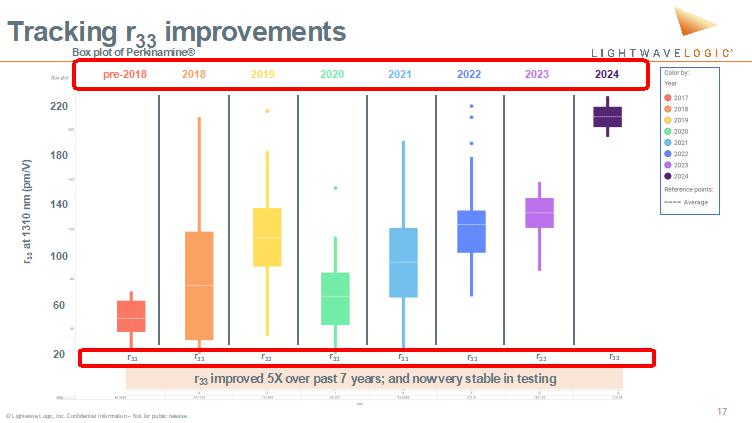
Oh and that R33 looks to be north of 200 now which was a long-time goal from back in the day
On the horizon I see 3 things of interest, the Volume has dropped not good for the shorts, T+1 is coming in 3 Weeks, that may be the reason for the volume as the MM's/Brokers begin to adjust as they will loose 1 day of juggling (not sure), Shareholders meeting is in a week and a half.
X Fab(ulous)
Recent LWLG News
- Form 8-K - Current report • Edgar (US Regulatory) • 05/24/2024 08:01:14 PM
- Lightwave Logic and Advanced Micro Foundry (AMF) Partner to Accelerate Development of Silicon Photonics Modulators Using Electro-Optic Polymers • PR Newswire (US) • 05/21/2024 12:31:00 PM
- Lightwave Logic Provides First Quarter 2024 Corporate Update • PR Newswire (US) • 05/13/2024 12:31:00 PM
- Form 10-Q - Quarterly report [Sections 13 or 15(d)] • Edgar (US Regulatory) • 05/10/2024 08:41:09 PM
- Lightwave Logic Demonstrates Thought Leadership with Critical Contributions to Global Integrated Photonics Industry Roadmap • PR Newswire (US) • 04/16/2024 12:31:00 PM
- Lightwave Logic Secures New Patent for Diamondoid Non-linear Optical Chromophore Patent to Improves Material Robustness • PR Newswire (US) • 04/01/2024 12:31:00 PM
- Lightwave Logic EO Polymer Achieves World-Class Performance of 400Gbps with Plasmonic Mach Zehnder Modulator • PR Newswire (US) • 03/28/2024 12:31:00 PM
- Lightwave Logic Demonstrates World-Class 200Gbps Heterogeneous Polymer/Silicon Photonic Modulator Results • PR Newswire (US) • 03/25/2024 12:31:00 PM
- Lightwave Logic to Host Annual Meeting of Shareholders on May 22, 2024 • PR Newswire (US) • 03/19/2024 12:31:00 PM
- Lightwave Logic to Participate in Upcoming Investor Conferences • PR Newswire (US) • 03/15/2024 12:31:00 PM
- Lightwave Logic Provides Fourth Quarter and Fiscal Year 2023 Corporate Update • PR Newswire (US) • 03/01/2024 01:31:00 PM
- Form 10-K - Annual report [Section 13 and 15(d), not S-K Item 405] • Edgar (US Regulatory) • 02/29/2024 10:09:53 PM
- Form 4 - Statement of changes in beneficial ownership of securities • Edgar (US Regulatory) • 12/08/2023 09:00:04 PM
- Form 144 - Report of proposed sale of securities • Edgar (US Regulatory) • 12/07/2023 12:11:28 AM
- Lightwave Logic Issues Shareholder Letter and Provides Corporate Update • PR Newswire (US) • 12/04/2023 01:31:00 PM
- Small Cap Recipient of Military Drone Technology • InvestorsHub NewsWire • 11/20/2023 01:14:45 PM
- Epazz, Inc. (OTC Pink: EPAZ) ZenaDrone Demonstration to Defense Departments of UAE and Saudi Arabia • InvestorsHub NewsWire • 11/15/2023 12:19:31 PM
- Lightwave Logic Provides Third Quarter 2023 Corporate Update • PR Newswire (US) • 11/10/2023 01:31:00 PM
- Form 10-Q - Quarterly report [Sections 13 or 15(d)] • Edgar (US Regulatory) • 11/09/2023 09:24:23 PM
- Lightwave Logic to Participate in Upcoming Investor Conferences • PR Newswire (US) • 11/06/2023 01:31:00 PM
- Lightwave Logic CEO Dr. Michael Lebby to Present at the Optica Photonic-Enabled Cloud Computing Industry Summit • PR Newswire (US) • 10/12/2023 12:50:00 PM
- Lightwave Logic Receives 2023 Industry Innovation Award for Hybrid PIC/Optical Integration Platform at the European Conference on Optical Communications • PR Newswire (US) • 10/03/2023 12:31:00 PM
- Form 8-K - Current report • Edgar (US Regulatory) • 10/02/2023 08:00:08 PM
- Lightwave Logic to Participate in Upcoming Investor Conferences • PR Newswire (US) • 09/05/2023 12:31:00 PM
- Lightwave Logic Expands Its Colorado Operations to Support New Commercial Activities • PR Newswire (US) • 08/21/2023 12:31:00 PM
Avant Technologies Engages Wired4Tech to Evaluate the Performance of Next Generation AI Server Technology • AVAI • May 23, 2024 8:00 AM
Branded Legacy, Inc. Unveils Collaboration with Celebrity Tattoo Artist Kat Tat for New Tattoo Aftercare Product • BLEG • May 22, 2024 8:30 AM
"Defo's Morning Briefing" Set to Debut for "GreenliteTV" • GRNL • May 21, 2024 2:28 PM
North Bay Resources Announces 50/50 JV at Fran Gold Project, British Columbia; Initiates NI 43-101 Resources Estimate and Bulk Sample • NBRI • May 21, 2024 9:07 AM
Greenlite Ventures Inks Deal to Acquire No Limit Technology • GRNL • May 17, 2024 3:00 PM
Music Licensing, Inc. (OTC: SONG) Subsidiary Pro Music Rights Secures Final Judgment of $114,081.30 USD, Demonstrating Strength of Licensing Agreements • SONGD • May 17, 2024 11:00 AM

