| Followers | 247 |
| Posts | 49961 |
| Boards Moderated | 51 |
| Alias Born | 08/29/2007 |
Saturday, April 27, 2024 12:53:30 PM

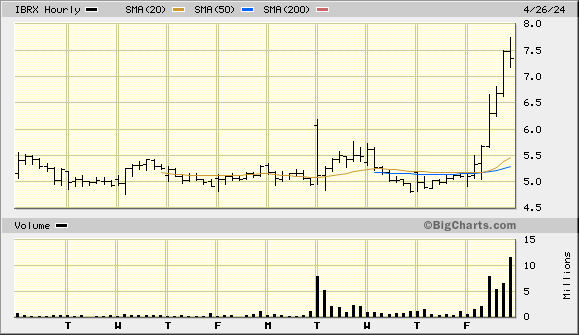
The stock is actually trading counter to a recent bearish trend for most tickers according my bit of DD from the Barchart website that would be considered med tech companies
This a link for the sector that is made up 459 tickers
https://www.barchart.com/stocks/quotes/IBRX/competitors?quoteSectors=-MEBI&viewName=main&orderBy=weightedAlpha&orderDir=desc
I have a free membership so I can use the flipcharts function for the past six months of price discovery
One can observe from the sector graph at the top of the page the best time to buy any old med stock was last November
The best time to sell was at the peak last March which isn’t that long ago
I can observe the same recurring pattern in the more than 200 tickers I flipped through
I am writing a book, American Cars of 1958. Check often for the latest addition. https://investorshub.advfn.com/American-Cars-of-1958-37252/
Recent IBRX News
- Form 10-Q - Quarterly report [Sections 13 or 15(d)] • Edgar (US Regulatory) • 05/09/2024 09:00:00 PM
- ImmunityBio Completes GMP Drug Substance Manufacturing Sufficient for 170,000 Doses of ANKTIVA® • Business Wire • 05/07/2024 12:00:00 PM
- ImmunityBio, Serum Institute of India Agree on an Exclusive Arrangement for Global Supply of Bacillus Calmette-Guerin (BCG) Across All Cancer Types • Business Wire • 05/02/2024 08:04:00 PM
- ImmunityBio Executive Chairman Dr. Patrick Soon-Shiong to Discuss ANKTIVA® Approval in Fireside Chat at the Annual Conference of the American Urological Association • Business Wire • 04/30/2024 12:00:00 PM
- ImmunityBio Announces Positive Overall Survival Results of Anktiva Combined With Checkpoint Inhibitors in Non-Small Cell Lung Cancer; Meeting Scheduled with FDA to Discuss Registration Path for ANKTIVA in Lung Cancer • Business Wire • 04/25/2024 04:03:00 AM
- ImmunityBio Announces FDA Approval of ANKTIVA®, First-in-Class IL-15 Receptor Agonist for BCG-Unresponsive Non-Muscle Invasive Bladder Cancer • Business Wire • 04/23/2024 01:56:00 AM
- NIAID-Sponsored Study Shows N-803 Combined with Neutralizing Antibodies Could Lead to Sustained HIV Viral Control After Discontinuation of Antiretroviral Therapy • Business Wire • 03/06/2024 02:00:00 PM
- N-803 Combined with Natural Killer Cells Showed Potential to Reduce HIV Viral Load in HIV Positive Subjects; Part of HIV Cure Study • Business Wire • 03/05/2024 02:00:00 PM
- Form 4 - Statement of changes in beneficial ownership of securities • Edgar (US Regulatory) • 02/26/2024 09:43:17 PM
- Form 4 - Statement of changes in beneficial ownership of securities • Edgar (US Regulatory) • 02/26/2024 09:40:11 PM
- Form 4 - Statement of changes in beneficial ownership of securities • Edgar (US Regulatory) • 02/26/2024 09:38:41 PM
- Form 8-K - Current report • Edgar (US Regulatory) • 02/24/2024 02:28:02 AM
- ImmunityBio Announces Full Accrual of First Two Phases of Cancer Vaccine Trial in Participants with Lynch Syndrome and Initiation of Randomized Controlled Phase of the Trial • Business Wire • 02/21/2024 02:00:00 PM
- Form 4 - Statement of changes in beneficial ownership of securities • Edgar (US Regulatory) • 02/07/2024 02:14:34 AM
- ImmunityBio Quality-of-Life Study in BCG-Unresponsive Bladder Cancer Trial Indicates Improved Physical Function in the 71% Complete Responders Suggesting a Favorable Risk-Benefit Ratio for N-803 Plus BCG • Business Wire • 02/05/2024 02:00:00 PM
- Form 4 - Statement of changes in beneficial ownership of securities • Edgar (US Regulatory) • 02/03/2024 12:38:38 AM
- Form 4 - Statement of changes in beneficial ownership of securities • Edgar (US Regulatory) • 02/03/2024 12:33:57 AM
- Form SC 13D/A - General statement of acquisition of beneficial ownership: [Amend] • Edgar (US Regulatory) • 01/04/2024 02:59:00 AM
- Form 4 - Statement of changes in beneficial ownership of securities • Edgar (US Regulatory) • 01/04/2024 02:41:54 AM
- Form 4 - Statement of changes in beneficial ownership of securities • Edgar (US Regulatory) • 01/04/2024 02:40:45 AM
- Form 8-K - Current report • Edgar (US Regulatory) • 01/02/2024 11:08:31 AM
- ImmunityBio Announces $320 Million Investment by Oberland Capital, with $210 Million Funded at Closing, Bringing Total Financing in 2023 to $850 Million • Business Wire • 01/02/2024 11:00:00 AM
- ImmunityBio to Participate in 35th Annual Piper Sandler Healthcare Conference • Business Wire • 11/16/2023 02:00:00 PM
- Form 10-Q - Quarterly report [Sections 13 or 15(d)] • Edgar (US Regulatory) • 11/09/2023 02:28:46 AM
- First Data for ImmunityBio’s Memory Cytokine-Enriched NK Cells in Small Cell Lung Cancer at SITC Meeting Show Promising Anti-tumor Activity • Business Wire • 11/07/2023 02:00:00 PM
Avant Technologies Equipping AI-Managed Data Center with High Performance Computing Systems • AVAI • May 10, 2024 8:00 AM
VAYK Discloses Strategic Conversation on Potential Acquisition of $4 Million Home Service Business • VAYK • May 9, 2024 9:00 AM
Bantec's Howco Awarded $4.19 Million Dollar U.S. Department of Defense Contract • BANT • May 8, 2024 10:00 AM
Element79 Gold Corp Successfully Closes Maverick Springs Option Agreement • ELEM • May 8, 2024 9:05 AM
Kona Gold Beverages, Inc. Achieves April Revenues Exceeding $586,000 • KGKG • May 8, 2024 8:30 AM
Epazz plans to spin off Galaxy Batteries Inc. • EPAZ • May 8, 2024 7:05 AM


