CoT: Peek Into Future Through Futures, How Hedge Funds Are Positioned By: Hedgopia | April 27, 2024
• Following futures positions of non-commercials are as of April 23, 2024.
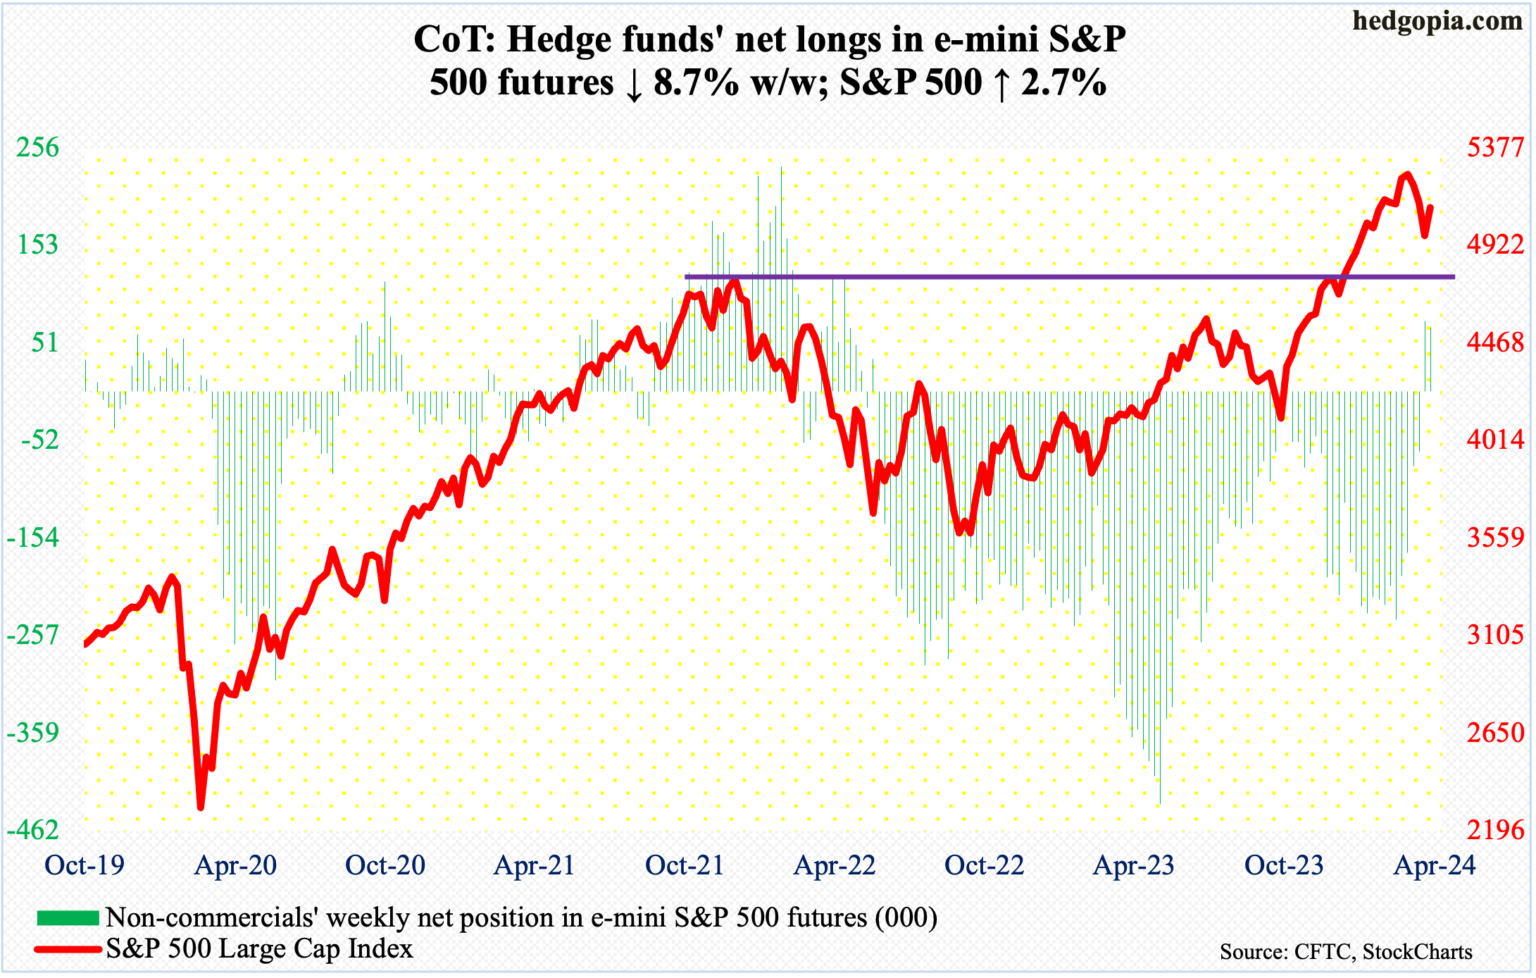
E-mini S&P 500: Currently net long 67.7k, down 6.4k.
Equity bulls’ mettle is being tested and it will only get intense next week. They put their foot down this week after the S&P 500 gave back 5.9 percent intraday from the March 28th high. The large cap index ticked 5265 in that session and turned lower, having tried and failed to clear 5260s in three sessions over seven.
Last Friday, the index tagged 4954. This week, it rallied 2.7 percent to 5100, with Friday’s intraday high of 5115, which just about tested the 50-day at 5124. The S&P 500 has been under the average for 10 sessions now.
Concurrently, several daily indicators such as the RSI have approached the median, and this is a decision time for the bulls – as well as for the bears. If the RSI, for instance, turns back down, then the latter will be eyeing at least last Friday’s low.
In due course, breakout retest at 4819 is just a matter of time. That was the prior high from January 2022 and the S&P 500 waited two years to surpass the old high this January.
Sentiment has taken a hit in recent weeks, but not low enough to signal a durable bottom (more on this here).
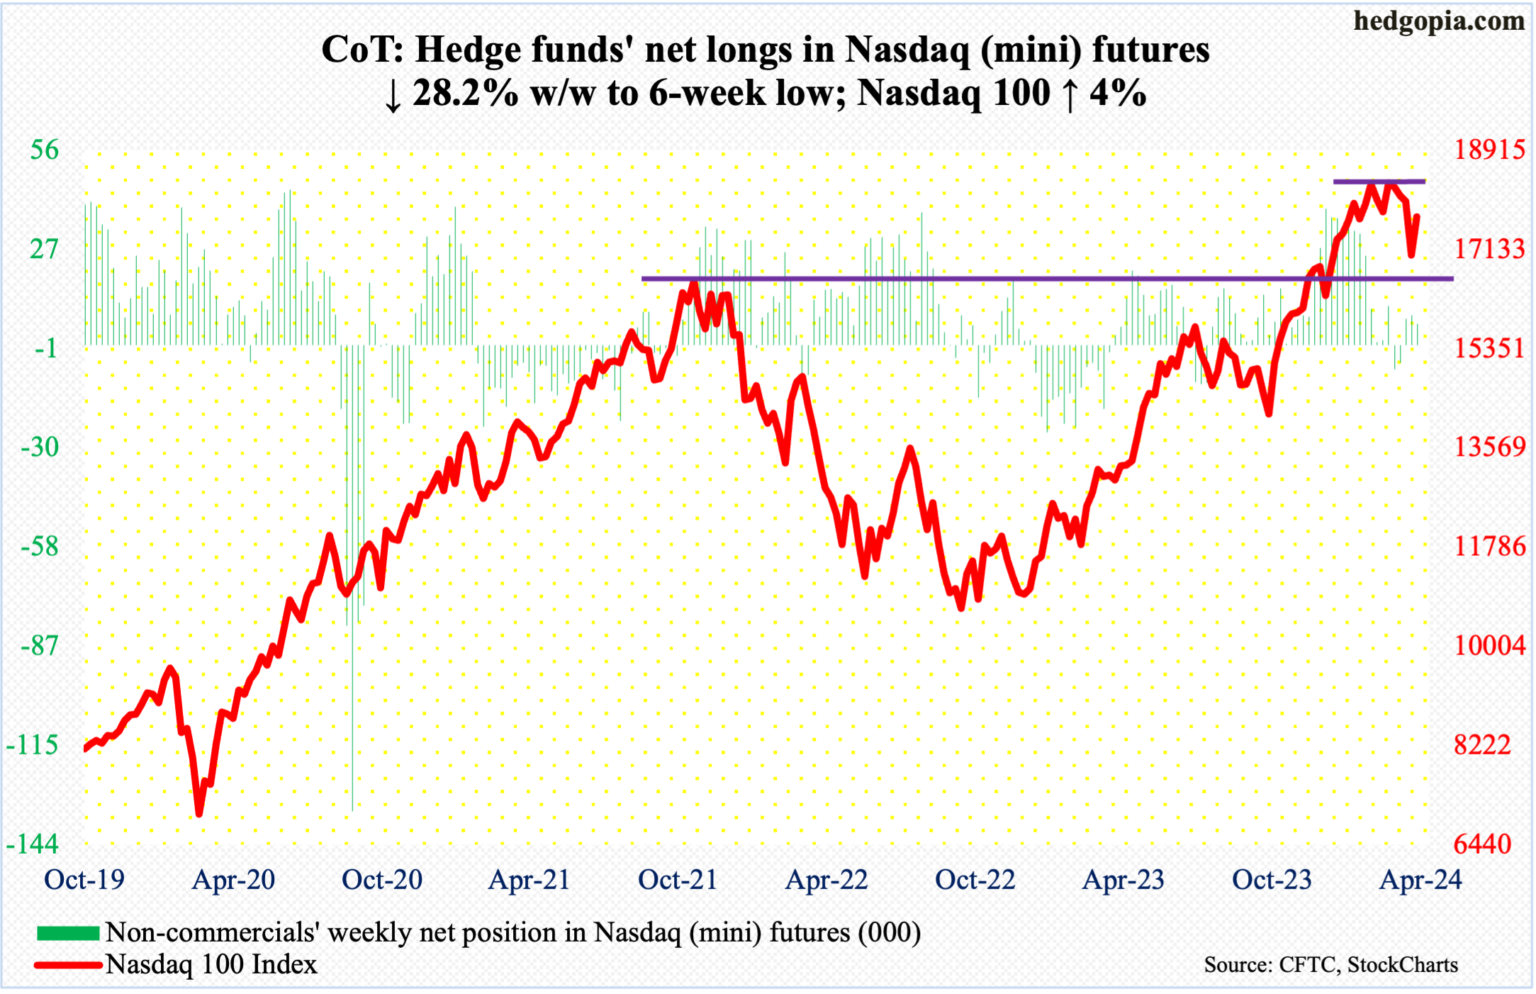
Nasdaq (mini): Currently net long 6.1k, down 2.4k.
The Nasdaq 100 had a topsy-turvy week, with a high of 17773 and a low of 17010. Until Thursday, it touched 17172 intraday; early on it that session, bulls were on the back foot reacting to Meta’s (META) March-quarter results. Then, come Friday, they came roaring back on the back of results from Microsoft (MSFT) and Google owner Alphabet (GOOG). In the end, tech bulls could not have asked for more (more on this here). The tech-heavy index shot up four percent for the week to 17718.
This came after four consecutive down weeks. The Nasdaq 100 posted a new intraday high of 18465 on March 21st but failed to sustainably break out of 18300s for seven weeks before rolling over. By last Friday, it ticked 16974, down 8.1 percent from the high.
Next week, Amazon (AMZN) reports on Tuesday and Apple (AAPL) on Thursday. If these results help and the index continues higher, the 50-day, which was breached 10 sessions ago, is at 17939. After that comes 18200, which is where trendline resistance from the March 21st high, rests.
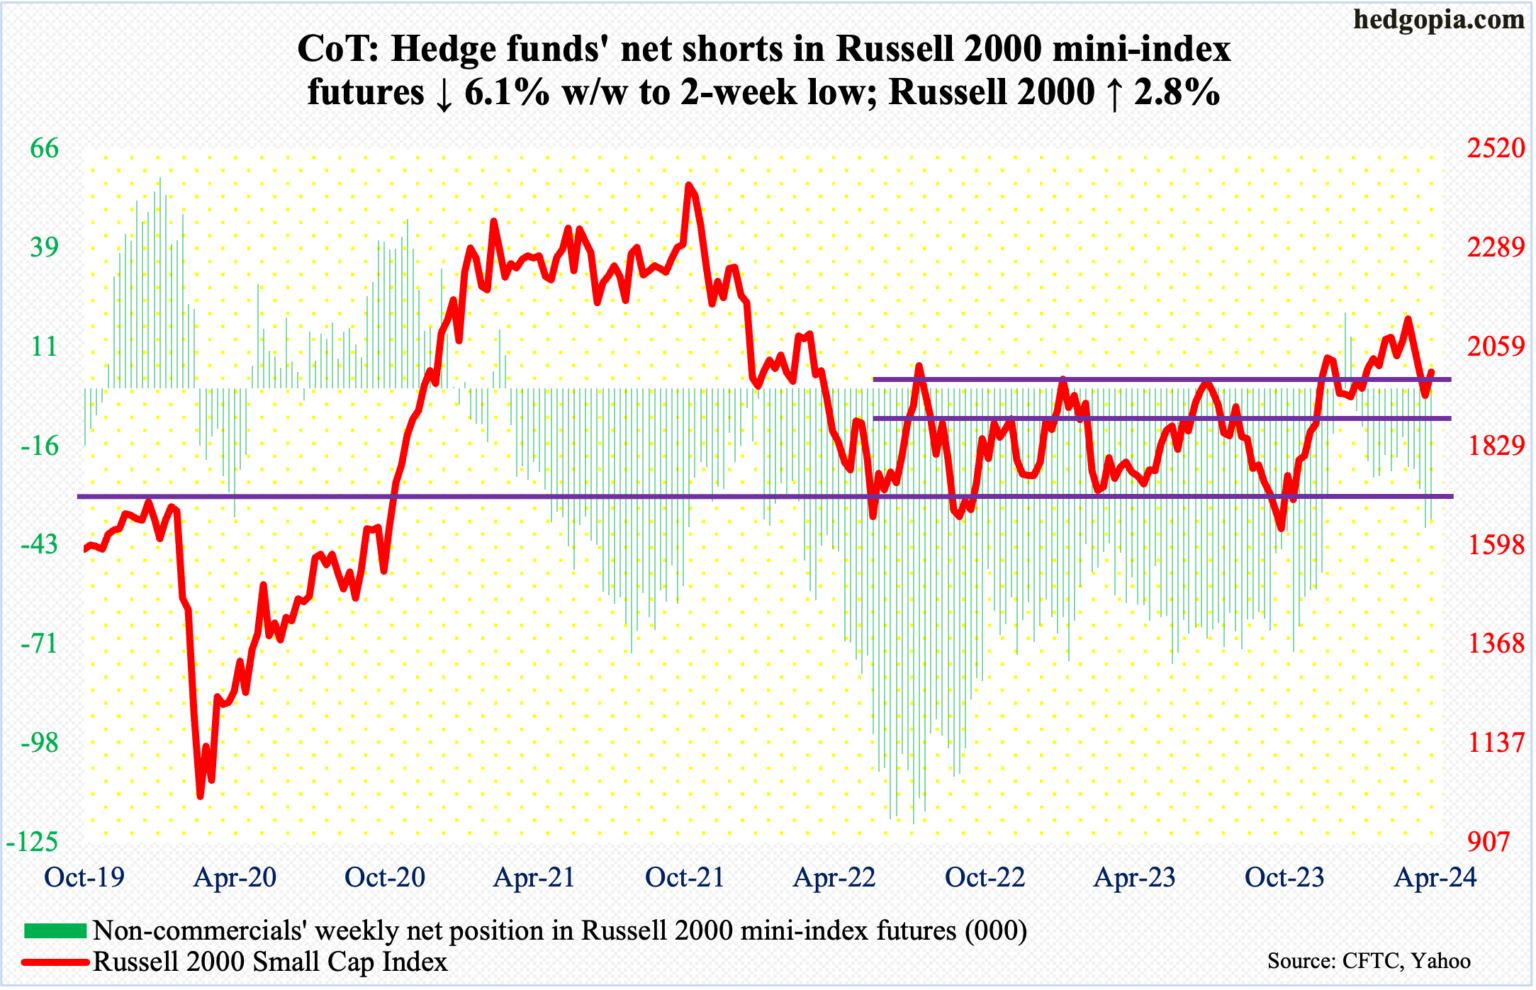
Russell 2000 mini-index: Currently net short 36.1k, down 2.4k.
The Russell 2000 is back at 2000, closing up 2.8 percent this week to 2002; last week, it fell by the same amount from 2003. There is decent support/resistance at 2000. Earlier, after several attempts for a month through early this month, small-cap bulls failed to convincingly break out of 2100. Subsequently, the index dropped to 1932 last Friday.
As things stand, it is a toss-up between the bulls and bears. Inability to push through 2000 eventually opens the door to breakout retest at 1900. On December 13th, the index broke out of a 1700-1900 range in place since January 2022.
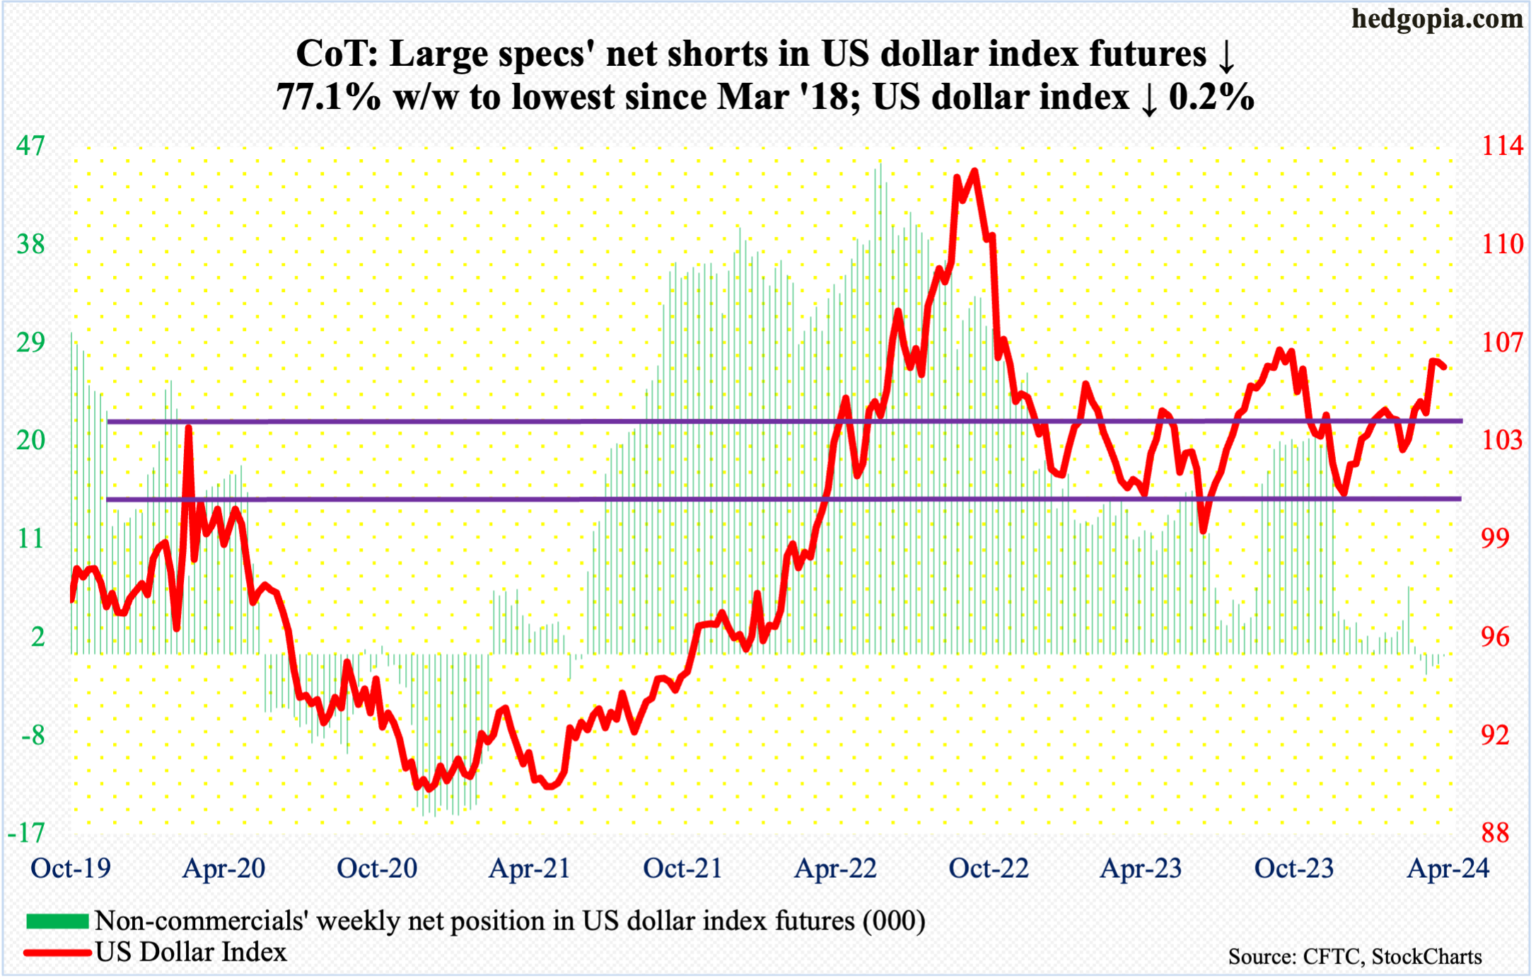
US Dollar Index: Currently net short 213, down 716.
The US dollar index suffered its back-to-back down week, although the decline has been nothing to write home about. This week, it closed at 105.80, versus last week’s close of 105.98 and 106.01 before that.
Dollar bulls were unable to build on a 1.9-percent jump three weeks ago. Selling pressure has picked up just north of 106. Ideally, they would have loved to test 107, which between early October and early November last year rejected rally attempts several times.
Earlier, the index bottomed at 100.32 last December, followed by a takeout three weeks ago of 103-104, which goes back to December 2016.
On the weekly, the path of least resistance is down.
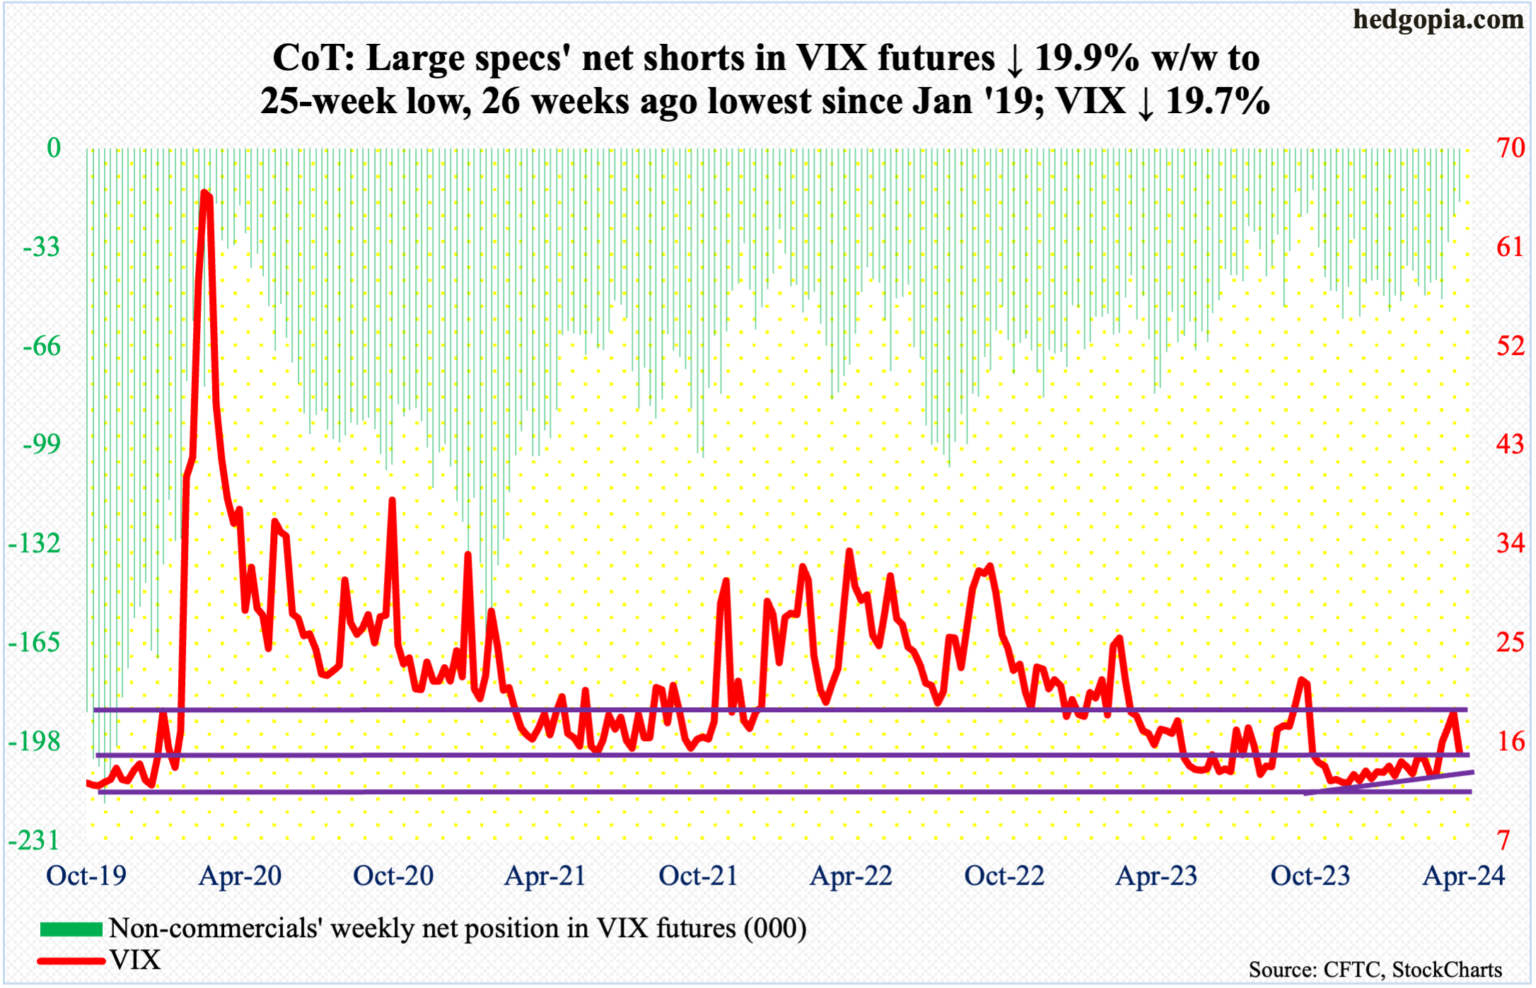
VIX: Currently net short 18k, down 4.5k.
After three up weeks – each of them with long upper wicks – VIX tumbled 3.68 points this week to 15.03. The 50- and 200-day are right underneath – 14.84 and 14.87 respectively. If volatility bulls fail to save these averages, the index could test the 13 handle in no time. Next week is key.
Non-commercials, in the meantime, continued to reduce net shorts in VIX futures. At 18,000 contracts, holdings are at a 25-week low. In the week to October 31st last year, when equities were bottoming, these traders cut net shorts to 13,979 before accumulating again. Historically, VIX has tended to peak as these traders either go net long or get close to doing that.
Information posted to this board is not meant to suggest any specific action, but to point out the technical signs that can help our readers make their own specific decisions. Caveat emptor! • DiscoverGold
Register for free to join our community of investors and share your ideas. You will also get access to streaming quotes, interactive charts, trades, portfolio, live options flow and more tools.


 News
News  Market Data
  Discover