


| Followers | 679 |
| Posts | 140990 |
| Boards Moderated | 36 |
| Alias Born | 03/10/2004 |
Wednesday, April 17, 2024 9:22:55 AM
By: Bruce Powers | April 16, 2024
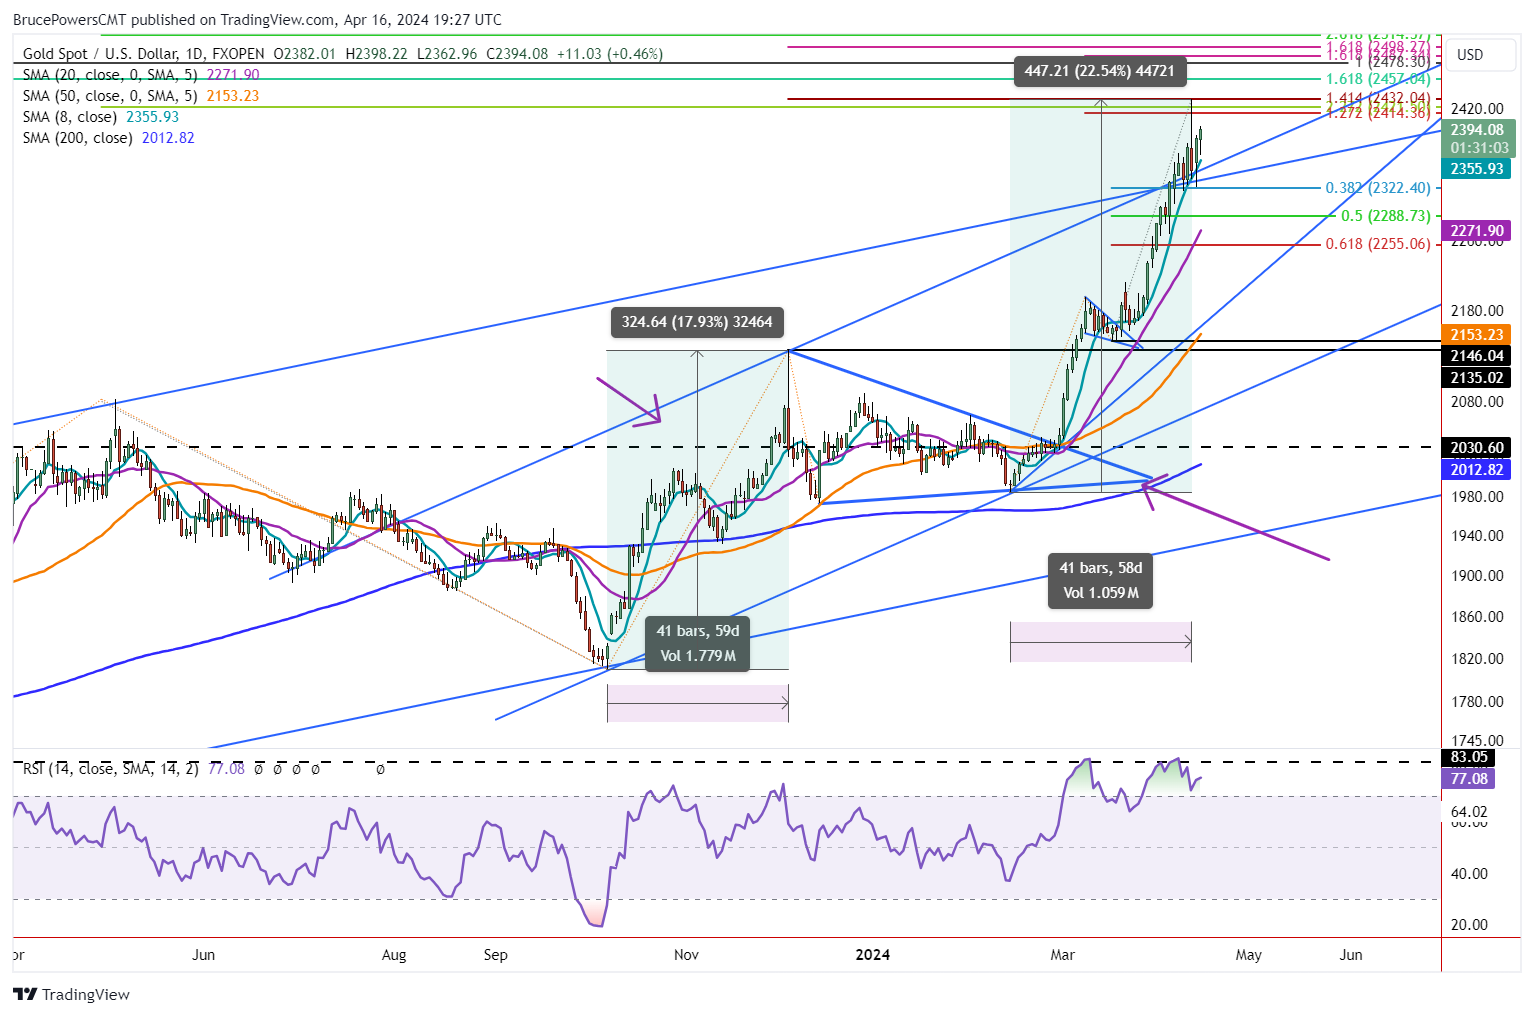
• Gold's recent bounce off support and completion of a Fibonacci retracement indicate potential for higher prices, but a daily close above last week's high is needed for confirmation.
Following last week’s record high of 2,431 in gold, it has been testing support around the 8-Day MA, now at 2,354. Yesterday, it bounced off a low of 2,324 thereby successfully completing a 38.2% Fibonacci retracement. Also, support has been seen above the two top channel trendlines that cross around April 4 rather than trading below it.
Bounces off 38.2% Fibonacci Support
The subsequent intraday advance bodes well for higher prices. However, it remains to be seen whether that will happen before or after a deeper retracement. Generally, in Fibonacci ratio analysis, the 38.2% retracement is watched as a minimum pullback before the primary trend may exert itself. Since that has been accomplished, a bullish continuation is possible.
Risk of Deeper Pullback Remains
Nonetheless, a daily close above last week’s high is needed to confirm a bullish trend continuation. Until then, another pullback remains possible. A drop below Monday’s low will be a sign of weakness that could lead to a deeper pullback. If hit, gold would then also be clearly below the 20-Day line, a further sign of weakness.
If the 8-Day line is busted, then the 20-Day MA at 2,271 becomes a target. Further, the 50% retracement is slightly above there at 2,289. A little lower is the 61.8% Fibonacci retracement level at 2,255. Support could be seen near any of those price levels. The more significant potential support zone is down near the 50-Day MA at 2,153 and the prior record high of 2,135 from early-December.
Evidence to Suggest at Least a Temporary Top Was Reached
In addition to the Fibonacci confluence zone (more than two Fibonacci levels) seen near the current record high, there is also both time and price symmetry that points to a possible high. Once there is a match with the current advance relative to a prior swing, the chance for a reversal increases.
There have been two legs up off the swing low bottom in October of last year. The first leg up hit a top in 41 trading days. Last Friday’s high was 41 trading days from the start of the second leg up on February 14. Price symmetry is not as close of a match as the first leg up advanced by 17.9% and the second rallied by 22.5%.
Read Full Story »»»
 DiscoverGold
Information posted to this board is not meant to suggest any specific action, but to point out the technical signs that can help our readers make their own specific decisions. Caveat emptor!
• DiscoverGold
Recent GOLD News
- Barrick Announces Extensive Exploration Partnership with Geophysx Jamaica • GlobeNewswire Inc. • 05/01/2024 10:15:00 AM
- Barrick to Ramp Up Production As It Remains On Track to Achieve 2024 Targets • GlobeNewswire Inc. • 05/01/2024 10:00:00 AM
- Barrick Declares Q1 Dividend • GlobeNewswire Inc. • 05/01/2024 09:59:00 AM
- Barrick Announces Election of Directors • GlobeNewswire Inc. • 04/30/2024 08:15:55 PM
- Barrick On Track to Achieve 2024 Targets • GlobeNewswire Inc. • 04/16/2024 11:00:00 AM
- Notice of Release of Barrick’s First Quarter 2024 Results • GlobeNewswire Inc. • 04/09/2024 11:00:00 AM
- Strategy-Driven Barrick Builds on Value Foundation • GlobeNewswire Inc. • 03/28/2024 09:20:38 PM
- Barrick Hunts New Gold and Copper Prospects in DRC From Kibali Base • GlobeNewswire Inc. • 03/20/2024 02:00:00 PM
- Barrick Opens Academy at Closed Buzwagi Mine • GlobeNewswire Inc. • 03/18/2024 08:00:00 AM
- Barrick to Grow Production and Value on Global Asset Foundation • GlobeNewswire Inc. • 03/15/2024 11:53:01 AM
- Loulo-Gounkoto Delivers Another Value-Creating Performance • GlobeNewswire Inc. • 03/10/2024 10:00:00 AM
- Passing of the Right Honorable Brian Mulroney • GlobeNewswire Inc. • 03/02/2024 01:17:35 AM
- Kibali and DRC Partner to Promote Local Content • GlobeNewswire Inc. • 03/01/2024 02:22:43 PM
- Tanzanian Parliamentary Committee Lauds Barrick’s Work at North Mara • GlobeNewswire Inc. • 02/23/2024 12:00:00 PM
- Form 6-K - Report of foreign issuer [Rules 13a-16 and 15d-16] • Edgar (US Regulatory) • 02/14/2024 10:28:08 PM
- Form 6-K - Report of foreign issuer [Rules 13a-16 and 15d-16] • Edgar (US Regulatory) • 02/14/2024 08:05:25 PM
- Clear Strategies and Strong Partnerships Set Barrick Up to Outperform, Says Bristow • GlobeNewswire Inc. • 02/14/2024 11:00:00 AM
- Barrick Announces New Share Buyback Program • GlobeNewswire Inc. • 02/14/2024 10:59:00 AM
- Barrick Declares Q4 Dividend • GlobeNewswire Inc. • 02/14/2024 10:58:00 AM
- NGM Strongly Positioned for Growth • GlobeNewswire Inc. • 02/10/2024 01:00:16 AM
- Form SC 13G - Statement of acquisition of beneficial ownership by individuals • Edgar (US Regulatory) • 02/08/2024 03:03:08 PM
- Form 6-K - Report of foreign issuer [Rules 13a-16 and 15d-16] • Edgar (US Regulatory) • 02/08/2024 12:46:55 PM
- Geologically Driven Asset Management Delivers Barrick’s Third Successive Year of Reserve Growth at Sustained Quality, While Unlocking Embedded Growth Portfolio • GlobeNewswire Inc. • 02/08/2024 12:00:00 PM
- Form SC 13G/A - Statement of acquisition of beneficial ownership by individuals: [Amend] • Edgar (US Regulatory) • 02/01/2024 06:04:56 PM
- Africa’s Largest Gold Mine Now Also One of Its Greenest • GlobeNewswire Inc. • 01/29/2024 04:00:00 PM
Bantec Engaged in a Letter of Intent to Acquire a Small New Jersey Based Manufacturing Company • BANT • May 1, 2024 10:00 AM
Cannabix Technologies to Deliver Breath Logix Alcohol Screening Device to Australia • BLO • Apr 30, 2024 8:53 AM
Hydromer, Inc. Reports Preliminary Unaudited Financial Results for First Quarter 2024 • HYDI • Apr 29, 2024 9:10 AM
Avant Technologies to Implement AI-Empowered, Zero Trust Architecture in Its Data Centers • AVAI • Apr 29, 2024 8:00 AM
Bantec Reports an Over 50 Percent Increase in Sales and Profits in Q1 2024 from Q1 2023 • BANT • Apr 25, 2024 10:00 AM
Cannabix's Breath Logix Alcohol Device Delivers Positive Impact to Private Monitoring Agency in Montana, USA • BLO • Apr 25, 2024 8:52 AM

