


| Followers | 686 |
| Posts | 142293 |
| Boards Moderated | 35 |
| Alias Born | 03/10/2004 |
Monday, April 15, 2024 4:26:45 PM
By: Bruce Powers | April 15, 2024
• The monthly chart for silver reveals a large bull flag pattern, suggesting a potential for sharp price rises if the breakout from the flag is sustained.
Following a drop to a three-day low and a decline below the 8-Day MA earlier in Monday’s trading session, silver rebounds sharply intraday to retake the lows and the moving average. It continues to trade near the highs of the day at the time of this writing. The question is, will silver be able to sustain a rally to new trend highs and beyond? Unfortunately, we won’t know the answer until there is a sustained break above last week’s high of 29.80. Given Fridays price action, it is questionable, but given today’s price action, the possibility again exists.
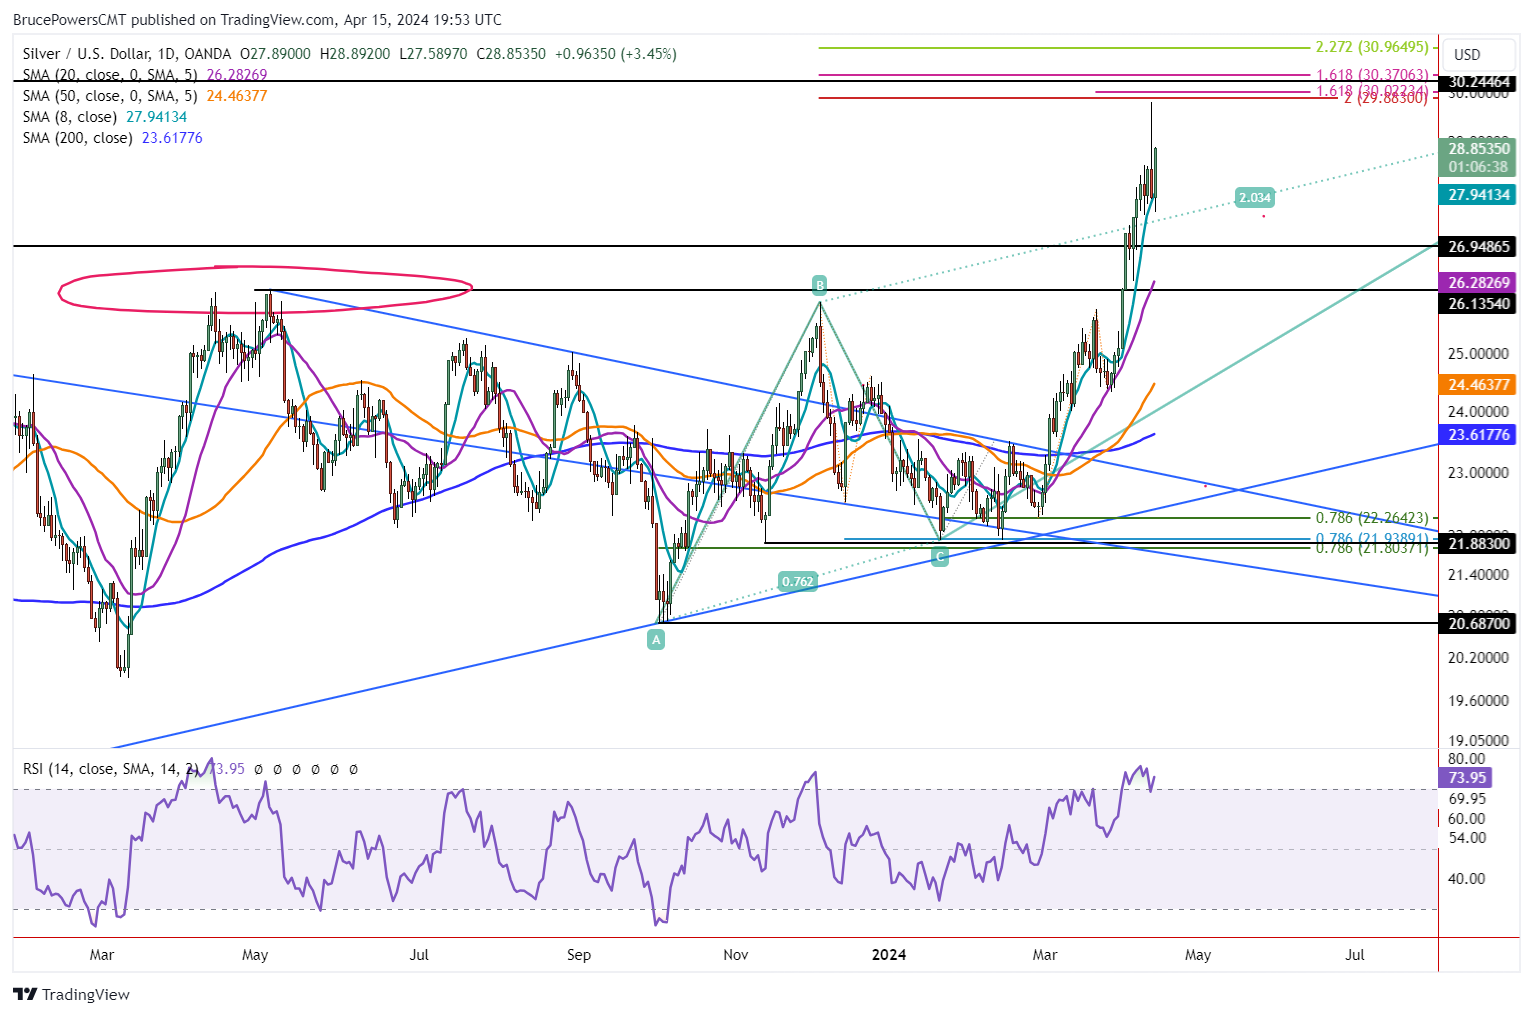
Strong Rebound Following Early Weakness
Silver rallied strong on Friday, but it closed weak. And the weak close came after a 5.47 point or 22.5% advance as of last week’s high. That measures the most recent swing that began from the Marc 28 pullback low. However, today’s bullish price action could lead to higher prices and complete a brief pullback in the price of silver. Silver popped up to test highs from 2020 and 2021 last week with its trend high of 29.80. A decisive breakout above the 30.14 swing high from 2021 would put silver at a greater than 9-year high.
Monthly Bullish Pattern Dominates
In the bigger picture, and seen in the enclosed monthly chart for silver, a large bull flag is present. The sharp move prior to the flag, referred to as the pole, saw silver rise by 156.5% in less than five months. With what looks like a sustainable breakout of the flag that triggered last month, silver has the potential to see prices rise sharply again.
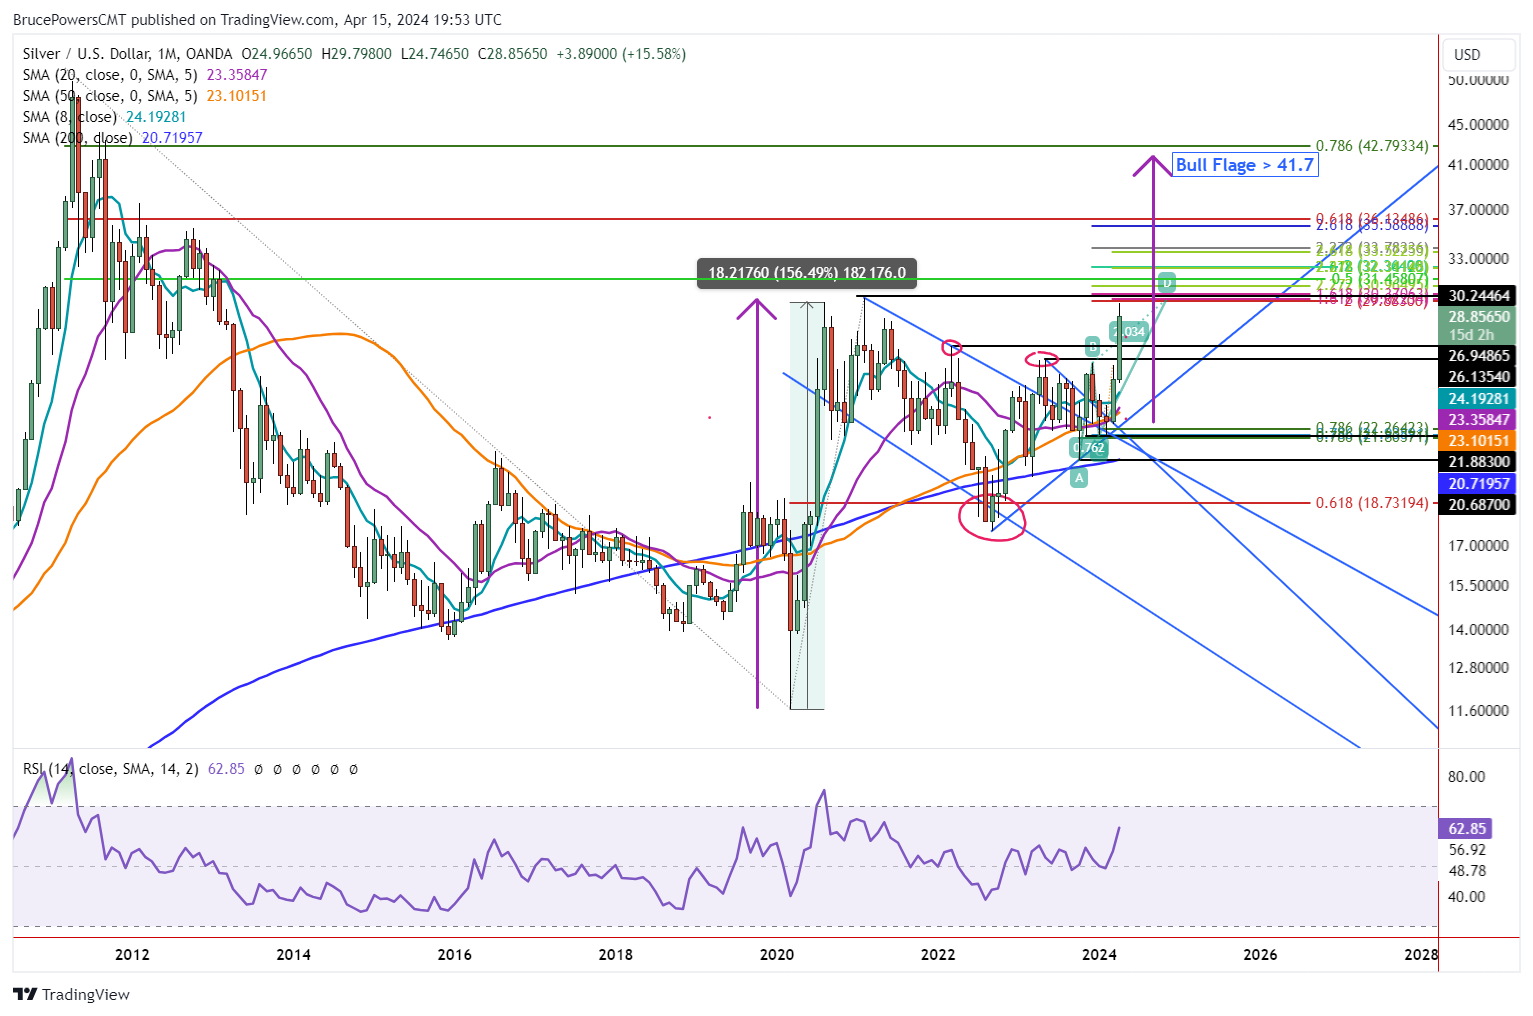
The measuring objective used to identify a target from the flag uses the distance in price seen in the pole and then projects that upward from the flag breakout area. There are two projected price areas then identified. One, based off a price match and the other from a percentage match. A 156.5% rally from the flag breakout, using 23.50, projects to 60.27. However, the dollar-based target is 41.7. That is 18.22 up from the flag breakout level.
Read Full Story »»»
 DiscoverGold
Information posted to this board is not meant to suggest any specific action, but to point out the technical signs that can help our readers make their own specific decisions. Caveat emptor!
• DiscoverGold
FEATURED POET Wins "Best Optical AI Solution" in 2024 AI Breakthrough Awards Program • Jun 26, 2024 10:09 AM
HealthLynked Promotes Bill Crupi to Chief Operating Officer • HLYK • Jun 26, 2024 8:00 AM
Bantec's Howco Short Term Department of Defense Contract Wins Will Exceed $1,100,000 for the current Quarter • BANT • Jun 25, 2024 10:00 AM
ECGI Holdings Targets $9.7 Billion Equestrian Apparel Market with Allon Brand Launch • ECGI • Jun 25, 2024 8:36 AM
Avant Technologies Addresses Progress on AI Supercomputer-Driven Data Centers • AVAI • Jun 25, 2024 8:00 AM
Green Leaf Innovations, Inc. Expands International Presence with New Partnership in Dubai • GRLF • Jun 24, 2024 8:30 AM

