


| Followers | 687 |
| Posts | 142406 |
| Boards Moderated | 35 |
| Alias Born | 03/10/2004 |
Friday, April 12, 2024 10:32:34 PM
By: Bruce Powers | April 12, 2024
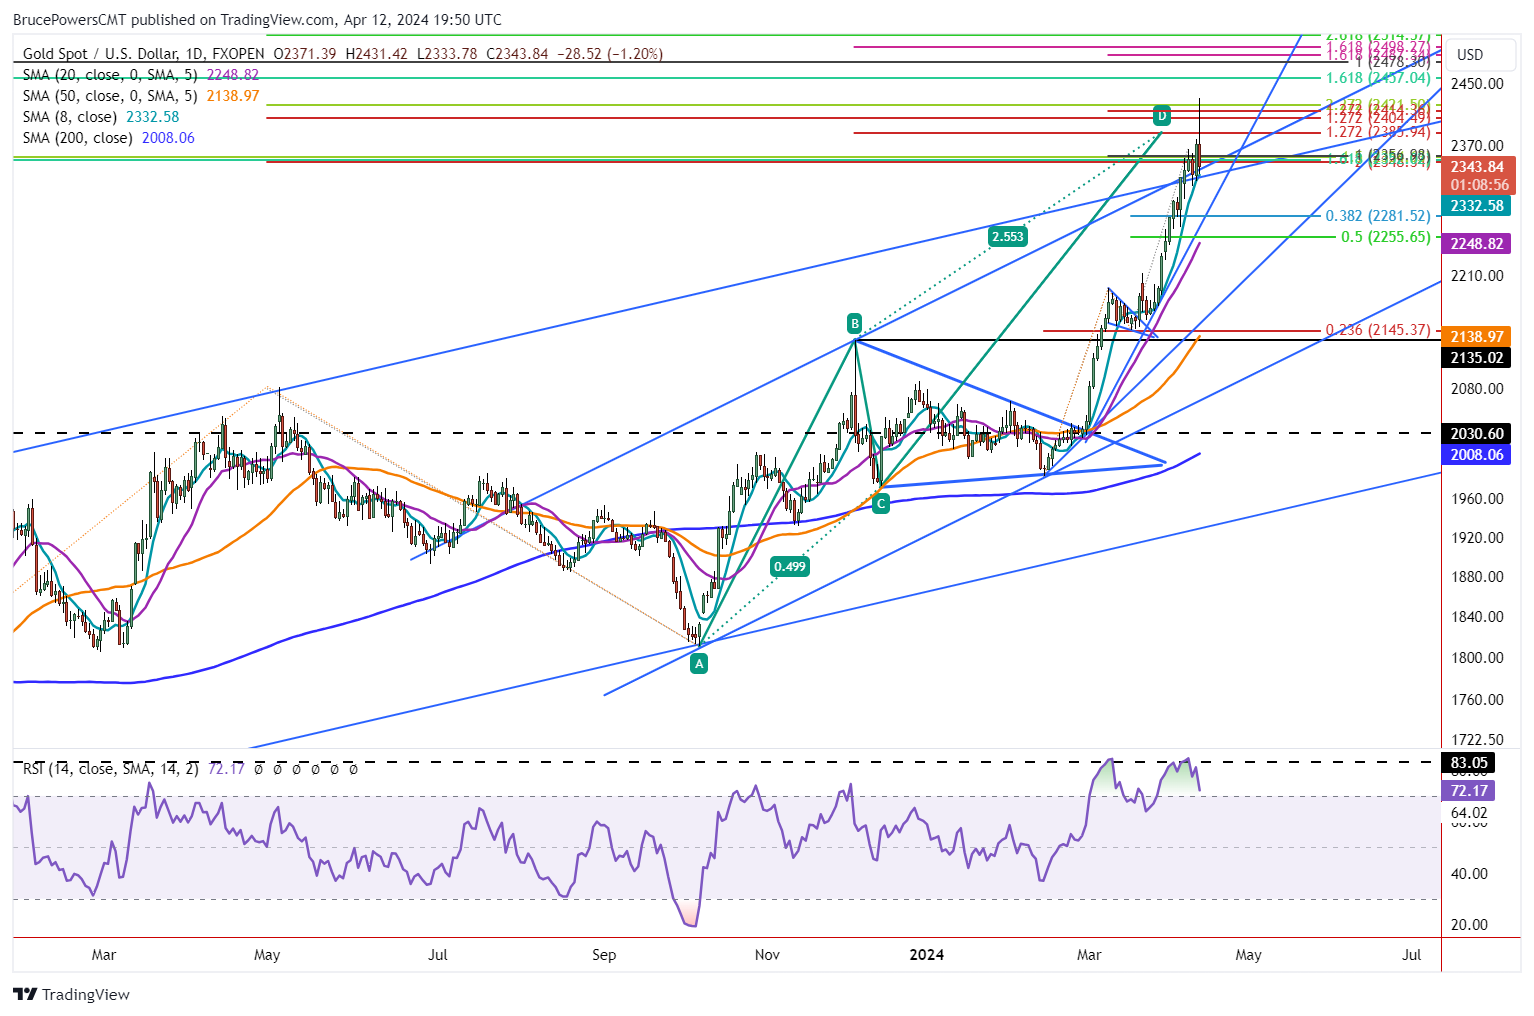
• Gold soared to a new record high of 2,431 before facing resistance, potentially marking a temporary top. Support near the 8-Day MA and Fibonacci levels will be crucial.
The runaway advance in gold headed to a new record high of 2,431 before resistance kicked in and turned the trend back down on an intraday basis. It looks like today could be the top for now. Today’s high exceeded the top of a Fibonacci confluence zone with a high of 2,422.
Support was subsequently seen near the 8-Day MA with a low of 2,334, at the time of this writing. In addition to the higher Fibonacci levels being reached a large ABCD pattern completed during today’s advance at 2,386.
Weak Close is Likely Clue for a Deeper Retracement
Gold is set to close weak, not only on the daily chart, but also on a weekly basis. Unless there is a rally prior to today’s close, gold will end the week with a bearish shooting star candlestick pattern. A weekly bearish signal will subsequently be given on a drop below this week’s low of 2,303. If hit, the short-term 8-Day MA will have already been broken.
Initial Retracement Levels
If a bearish retracement does trigger support might first be seen around the 38.2% Fibonacci retracement at 2,282. Also, the 50% retracement is at 2,256. However, since gold would be coming off a very aggressive rally, having risen as much as 22.5% from the February swing low of 1,984, a rapid recovery from a retracement may not come quickly.
Notice that the relative strength index (RSI) momentum oscillator has formed a double top and is fast turning back down from overbought conditions. The RSI has been the most overbought recently since the 2020 swing high.
Correction Could See Test of 20-Day MA
When considering the moving averages, a decline to test support around the 20-Day MA would not be surprising once the 8-Day line fails. It is currently at 2,249. Gold rose away from the 20-Day line prior to the symmetrical triangle breakout on February 29. Since then, there has not been a test of support at the line.
That means that once it is approached again, there is a good chance it will be tested. Today’s price action does not change the long-term bullish outlook for gold given its recent breakout from a multi-year basing pattern. As with all assets, profit taking eventually takes hold, weakening short-term demand and leading to a retracement.
Read Full Story »»»
 DiscoverGold
Information posted to this board is not meant to suggest any specific action, but to point out the technical signs that can help our readers make their own specific decisions. Caveat emptor!
• DiscoverGold
Recent GOLD News
- Exploration Success, Capital Investment and Reserve Growth to Sustain Kibali’s Production Profile • GlobeNewswire Inc. • 07/02/2024 04:00:00 PM
- Barrick and Zijin Contribute $1 Million to Support Papua New Guinea Landslide Victims • GlobeNewswire Inc. • 06/07/2024 11:18:39 AM
- Form SD - Specialized disclosure report • Edgar (US Regulatory) • 05/29/2024 08:01:04 PM
- Barrick’s Sustainability Strategy Delivers Real Value to Stakeholders • GlobeNewswire Inc. • 05/15/2024 11:00:00 AM
- Barrick Announces Extensive Exploration Partnership with Geophysx Jamaica • GlobeNewswire Inc. • 05/01/2024 10:15:00 AM
- Barrick to Ramp Up Production As It Remains On Track to Achieve 2024 Targets • GlobeNewswire Inc. • 05/01/2024 10:00:00 AM
- Barrick Declares Q1 Dividend • GlobeNewswire Inc. • 05/01/2024 09:59:00 AM
- Barrick Announces Election of Directors • GlobeNewswire Inc. • 04/30/2024 08:15:55 PM
- Barrick On Track to Achieve 2024 Targets • GlobeNewswire Inc. • 04/16/2024 11:00:00 AM
- Notice of Release of Barrick’s First Quarter 2024 Results • GlobeNewswire Inc. • 04/09/2024 11:00:00 AM
- Strategy-Driven Barrick Builds on Value Foundation • GlobeNewswire Inc. • 03/28/2024 09:20:38 PM
- Barrick Hunts New Gold and Copper Prospects in DRC From Kibali Base • GlobeNewswire Inc. • 03/20/2024 02:00:00 PM
- Barrick Opens Academy at Closed Buzwagi Mine • GlobeNewswire Inc. • 03/18/2024 08:00:00 AM
- Barrick to Grow Production and Value on Global Asset Foundation • GlobeNewswire Inc. • 03/15/2024 11:53:01 AM
- Loulo-Gounkoto Delivers Another Value-Creating Performance • GlobeNewswire Inc. • 03/10/2024 10:00:00 AM
- Passing of the Right Honorable Brian Mulroney • GlobeNewswire Inc. • 03/02/2024 01:17:35 AM
- Kibali and DRC Partner to Promote Local Content • GlobeNewswire Inc. • 03/01/2024 02:22:43 PM
- Tanzanian Parliamentary Committee Lauds Barrick’s Work at North Mara • GlobeNewswire Inc. • 02/23/2024 12:00:00 PM
- Form 6-K - Report of foreign issuer [Rules 13a-16 and 15d-16] • Edgar (US Regulatory) • 02/14/2024 10:28:08 PM
- Form 6-K - Report of foreign issuer [Rules 13a-16 and 15d-16] • Edgar (US Regulatory) • 02/14/2024 08:05:25 PM
- Clear Strategies and Strong Partnerships Set Barrick Up to Outperform, Says Bristow • GlobeNewswire Inc. • 02/14/2024 11:00:00 AM
- Barrick Announces New Share Buyback Program • GlobeNewswire Inc. • 02/14/2024 10:59:00 AM
- Barrick Declares Q4 Dividend • GlobeNewswire Inc. • 02/14/2024 10:58:00 AM
- NGM Strongly Positioned for Growth • GlobeNewswire Inc. • 02/10/2024 01:00:16 AM
- Form SC 13G - Statement of acquisition of beneficial ownership by individuals • Edgar (US Regulatory) • 02/08/2024 03:03:08 PM
Freedom Holdings Corporate Update; Announces Management Has Signed Letter of Intent • FHLD • Jul 3, 2024 9:00 AM
EWRC's 21 Moves Gaming Studios Moves to SONY Pictures Studios and Green Lights Development of a Third Upcoming Game • EWRC • Jul 2, 2024 8:00 AM
BNCM and DELEX Healthcare Group Announce Strategic Merger to Drive Expansion and Growth • BNCM • Jul 2, 2024 7:19 AM
NUBURU Announces Upcoming TV Interview Featuring CEO Brian Knaley on Fox Business, Bloomberg TV, and Newsmax TV as Sponsored Programming • BURU • Jul 1, 2024 1:57 PM
Mass Megawatts Announces $220,500 Debt Cancellation Agreement to Improve Financing and Sales of a New Product to be Announced on July 11 • MMMW • Jun 28, 2024 7:30 AM
VAYK Exited Caribbean Investments for $320,000 Profit • VAYK • Jun 27, 2024 9:00 AM

