


| Followers | 679 |
| Posts | 140990 |
| Boards Moderated | 36 |
| Alias Born | 03/10/2004 |
Wednesday, April 10, 2024 6:20:33 PM
By: Bruce Powers | April 10, 2024
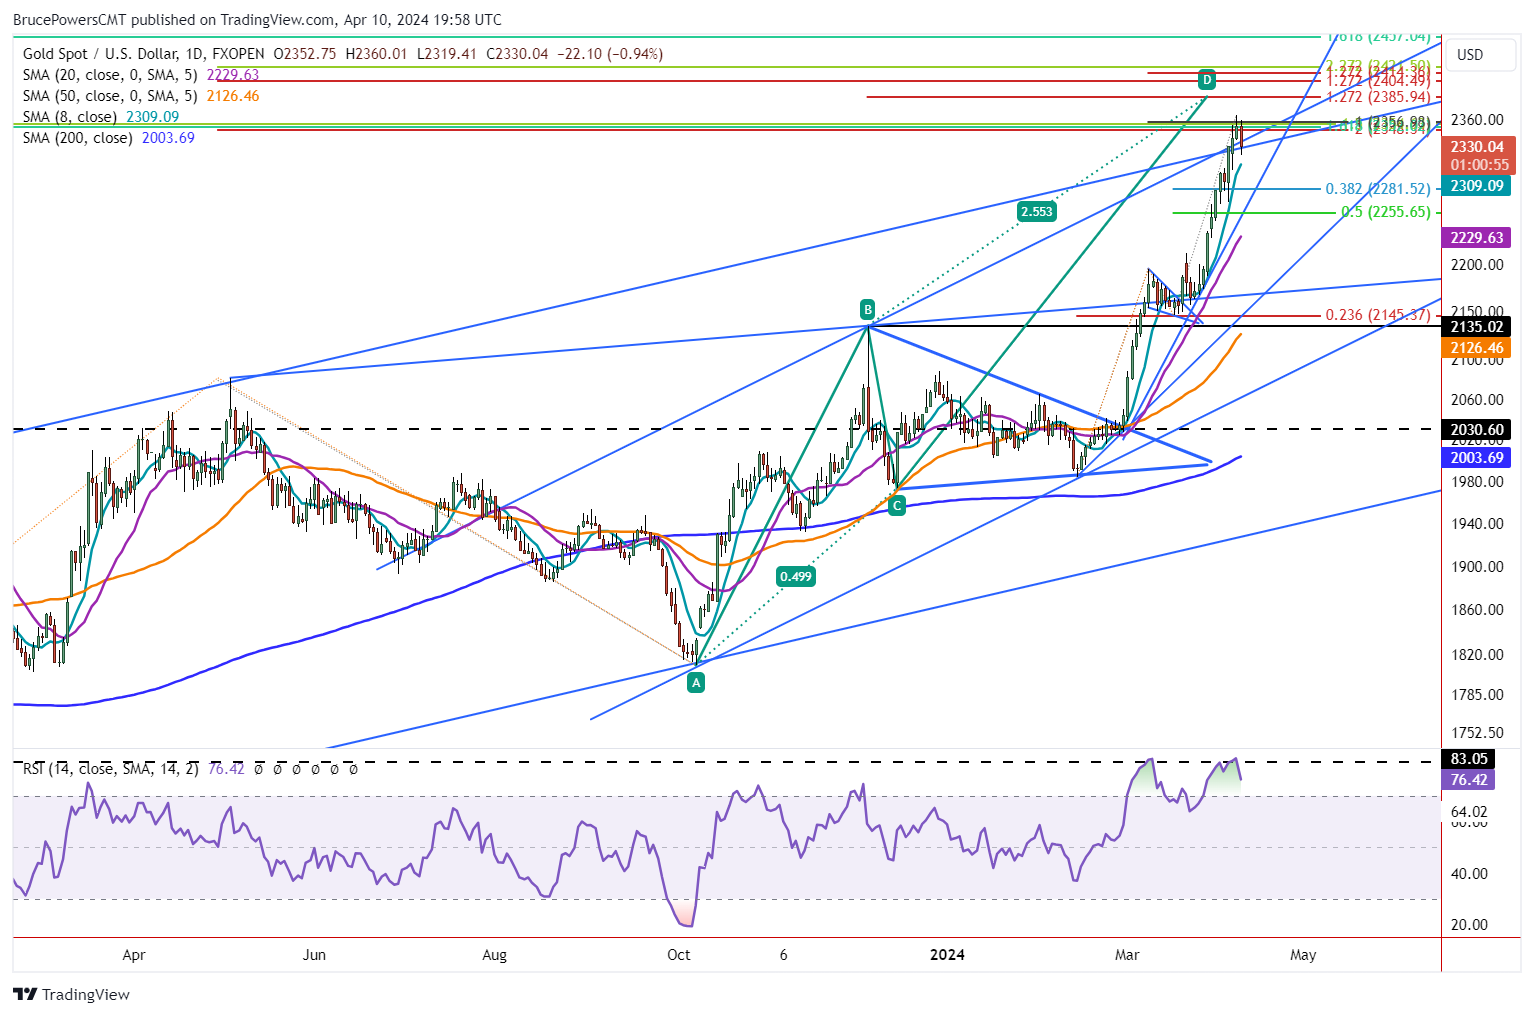
• A deeper pullback seems likely with the 8-Day MA at 2,319 showing near-term support.
Gold triggers a short-term bearish signal on a drop below yesterday’s low of 2,337. Also, it is on track to close below that level further confirming weakness and increasing the chance for a deeper pullback. As of this week’s new record high of 2,365, gold was up by 381 points or 19.2% from the February 14 swing low at 1,984. It is overdue for a retracement, even if it is short and shallow.
The relative strength index (RSI) may be reflecting a similar sentiment. Notice there is a double top present in the RSI, and it has risen to its highest reading since the peak in August 2020.
Weekly Trend Intact Above 2,228 Support
If a deeper retracement does come then last week’s low of 2,228 is going to be a key price level to watch for support, or higher. It is part of the price structure of the weekly trend. On the daily chart you can see how the 8-Day MA was tested as support last week and price was quickly rejected to the upside thereby confirming strong support.
Therefore, it could be an area of support again or mark a clean pivot towards lower price levels. Below the 8-Day line lies the 38.2% Fibonacci retracement at 2,282 and the 50% retracement at 2,256. The near-term uptrend line is also associated with those price areas but that depends on when the line is reached.
20-Day MA at 2,230 Key Support
A more significant price zone is represented by the 20-Day MA, now at 2,230. It helps determine the quality of the near-term trend. If gold stays above that line, strong upward momentum as seen recently may return. It usually is a more reliable line to gauge the market than the trendline. Gold remains in a near-term bullish posture if it stays above the 20-Day MA. Of course, this is relative to one’s time frame that is being used to engage the market.
Further Weakness Sets Up Bearish Weekly
Currently, the weekly chart shows weakness if it closed today. A bearish candle in the weekly chart would further point to a likely pullback before higher prices. In other words, where gold closes within the week’s trading range should provide clues as to whether it pulls back or continues to strengthen heading into next week.
Read Full Story »»»
 DiscoverGold
Information posted to this board is not meant to suggest any specific action, but to point out the technical signs that can help our readers make their own specific decisions. Caveat emptor!
• DiscoverGold
Recent GOLD News
- Barrick Announces Extensive Exploration Partnership with Geophysx Jamaica • GlobeNewswire Inc. • 05/01/2024 10:15:00 AM
- Barrick to Ramp Up Production As It Remains On Track to Achieve 2024 Targets • GlobeNewswire Inc. • 05/01/2024 10:00:00 AM
- Barrick Declares Q1 Dividend • GlobeNewswire Inc. • 05/01/2024 09:59:00 AM
- Barrick Announces Election of Directors • GlobeNewswire Inc. • 04/30/2024 08:15:55 PM
- Barrick On Track to Achieve 2024 Targets • GlobeNewswire Inc. • 04/16/2024 11:00:00 AM
- Notice of Release of Barrick’s First Quarter 2024 Results • GlobeNewswire Inc. • 04/09/2024 11:00:00 AM
- Strategy-Driven Barrick Builds on Value Foundation • GlobeNewswire Inc. • 03/28/2024 09:20:38 PM
- Barrick Hunts New Gold and Copper Prospects in DRC From Kibali Base • GlobeNewswire Inc. • 03/20/2024 02:00:00 PM
- Barrick Opens Academy at Closed Buzwagi Mine • GlobeNewswire Inc. • 03/18/2024 08:00:00 AM
- Barrick to Grow Production and Value on Global Asset Foundation • GlobeNewswire Inc. • 03/15/2024 11:53:01 AM
- Loulo-Gounkoto Delivers Another Value-Creating Performance • GlobeNewswire Inc. • 03/10/2024 10:00:00 AM
- Passing of the Right Honorable Brian Mulroney • GlobeNewswire Inc. • 03/02/2024 01:17:35 AM
- Kibali and DRC Partner to Promote Local Content • GlobeNewswire Inc. • 03/01/2024 02:22:43 PM
- Tanzanian Parliamentary Committee Lauds Barrick’s Work at North Mara • GlobeNewswire Inc. • 02/23/2024 12:00:00 PM
- Form 6-K - Report of foreign issuer [Rules 13a-16 and 15d-16] • Edgar (US Regulatory) • 02/14/2024 10:28:08 PM
- Form 6-K - Report of foreign issuer [Rules 13a-16 and 15d-16] • Edgar (US Regulatory) • 02/14/2024 08:05:25 PM
- Clear Strategies and Strong Partnerships Set Barrick Up to Outperform, Says Bristow • GlobeNewswire Inc. • 02/14/2024 11:00:00 AM
- Barrick Announces New Share Buyback Program • GlobeNewswire Inc. • 02/14/2024 10:59:00 AM
- Barrick Declares Q4 Dividend • GlobeNewswire Inc. • 02/14/2024 10:58:00 AM
- NGM Strongly Positioned for Growth • GlobeNewswire Inc. • 02/10/2024 01:00:16 AM
- Form SC 13G - Statement of acquisition of beneficial ownership by individuals • Edgar (US Regulatory) • 02/08/2024 03:03:08 PM
- Form 6-K - Report of foreign issuer [Rules 13a-16 and 15d-16] • Edgar (US Regulatory) • 02/08/2024 12:46:55 PM
- Geologically Driven Asset Management Delivers Barrick’s Third Successive Year of Reserve Growth at Sustained Quality, While Unlocking Embedded Growth Portfolio • GlobeNewswire Inc. • 02/08/2024 12:00:00 PM
- Form SC 13G/A - Statement of acquisition of beneficial ownership by individuals: [Amend] • Edgar (US Regulatory) • 02/01/2024 06:04:56 PM
- Africa’s Largest Gold Mine Now Also One of Its Greenest • GlobeNewswire Inc. • 01/29/2024 04:00:00 PM
Bantec Engaged in a Letter of Intent to Acquire a Small New Jersey Based Manufacturing Company • BANT • May 1, 2024 10:00 AM
Cannabix Technologies to Deliver Breath Logix Alcohol Screening Device to Australia • BLO • Apr 30, 2024 8:53 AM
Hydromer, Inc. Reports Preliminary Unaudited Financial Results for First Quarter 2024 • HYDI • Apr 29, 2024 9:10 AM
Avant Technologies to Implement AI-Empowered, Zero Trust Architecture in Its Data Centers • AVAI • Apr 29, 2024 8:00 AM
Bantec Reports an Over 50 Percent Increase in Sales and Profits in Q1 2024 from Q1 2023 • BANT • Apr 25, 2024 10:00 AM
Cannabix's Breath Logix Alcohol Device Delivers Positive Impact to Private Monitoring Agency in Montana, USA • BLO • Apr 25, 2024 8:52 AM

