


| Followers | 679 |
| Posts | 140990 |
| Boards Moderated | 36 |
| Alias Born | 03/10/2004 |
Tuesday, April 09, 2024 5:44:36 PM
By: Bruce Powers | April 9, 2024
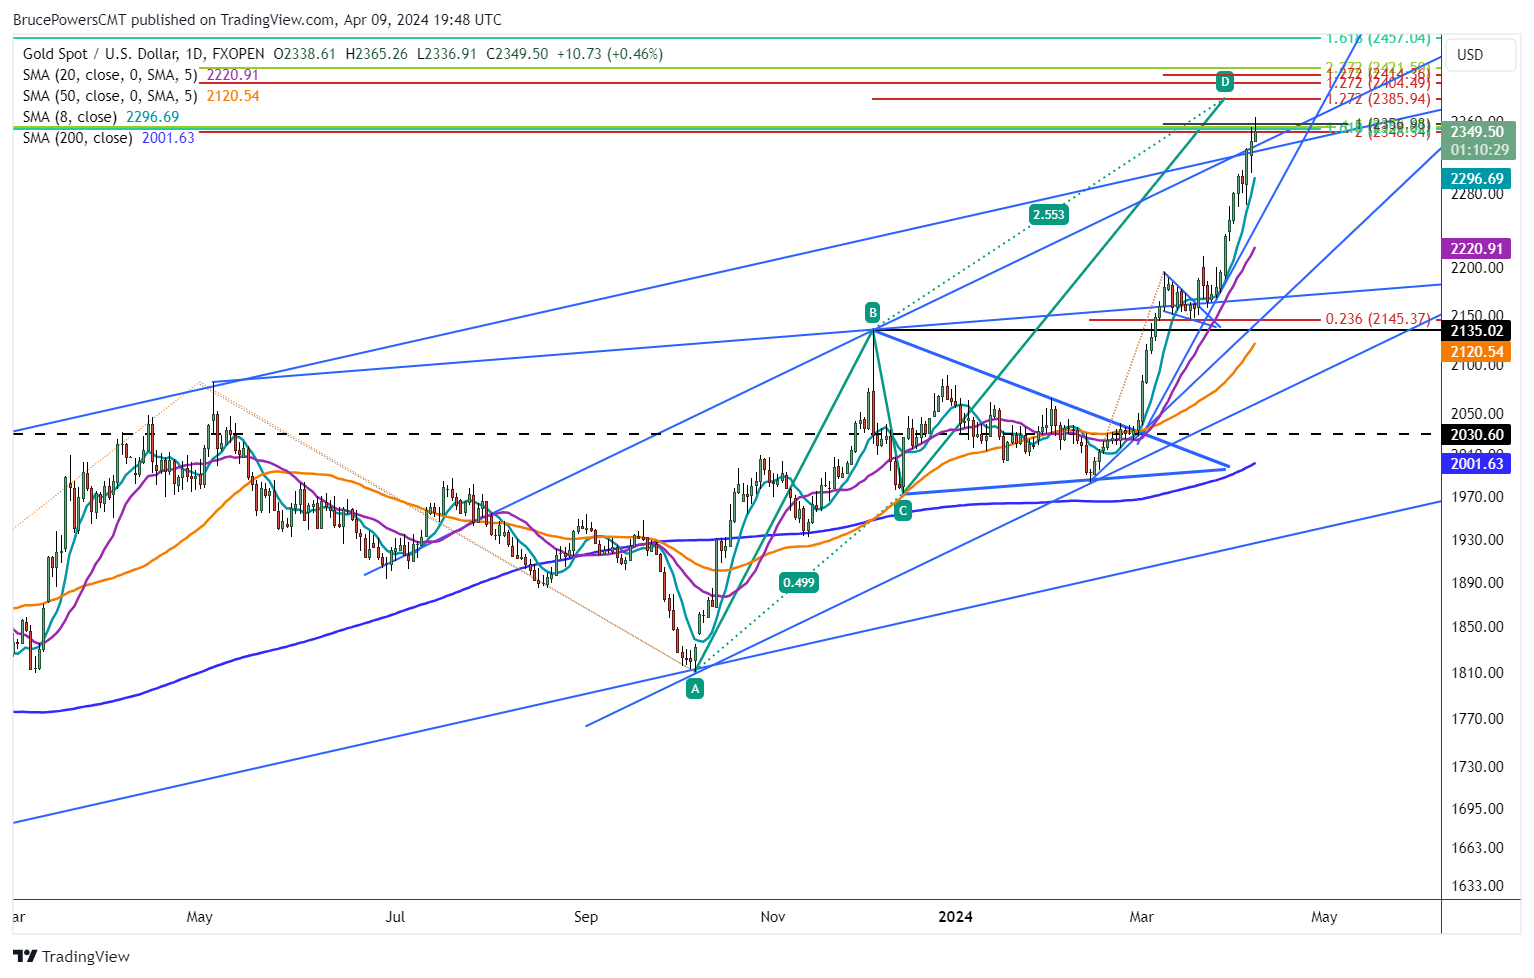
• Gold reached a new record high but faces potential resistance at a Fibonacci confluence zone, increasing chance of a retracement.
Gold looks to have stalled on Tuesday, following a new record high of 2,365 reached earlier in the session. It hit a potential resistance zone yesterday, based on Fibonacci confluence. The confluence zone shown on the chart is confirmed by more Fibonacci levels than any previously identified resistance zone since the rally began.
That is, since gold broke out of a symmetrical triangle consolidation pattern on February 29. In other words, gold is at the greatest risk of a retracement since the breakout. When more indicators identify a similar price zone the potential significance of that price zone increases. In addition, it may end the day with a bearish shooting star candlestick pattern.
Move Above 2,365, Says Rally is Not Over Yet
Nevertheless, if a decisive rally above today’s high of 2,365 triggers, higher prices will be in sight. The next higher price targets are at 2,386, followed by a Fibonacci confluence zone from around 2,404 to 2,421. The first level completes the target from a large rising ABCD pattern that is extended by the 127.2% Fibonacci ratio. It is interesting to note that there is a potential double top in the relative strength indicator (RSI) momentum oscillator. In addition, the oscillator is the most overbought since the summer of 2020.
8-Day Moving Average First Support Zone
If a pullback is in the plans before a new record high, then the first confirmation of weakness should be seen on a drop below today’s low of 2,337. There waw a quick pullback last week, but gold quickly bounced off support around the blue 8-Day MA. Certainly, it could do so again.
Currently, the 8-Day line is at 2,297. The 8-Day MA has done a good job of reflecting dynamic support for the current sharp rally. Nevertheless, given the aggressive move seen in the rally, a test of support around the 20-Day MA would not be a surprise. It is currently at 2,221. Or the uptrend line between the two moving averages could see support.
Following a correction gold is expected to continue to strengthen. It recently broke out of a three and a half year basing period and strength was confirmed with a new high monthly close. This means that the current uptrend is still in its early stages.
Read Full Story »»»
 DiscoverGold
Information posted to this board is not meant to suggest any specific action, but to point out the technical signs that can help our readers make their own specific decisions. Caveat emptor!
• DiscoverGold
Recent GOLD News
- Barrick Announces Extensive Exploration Partnership with Geophysx Jamaica • GlobeNewswire Inc. • 05/01/2024 10:15:00 AM
- Barrick to Ramp Up Production As It Remains On Track to Achieve 2024 Targets • GlobeNewswire Inc. • 05/01/2024 10:00:00 AM
- Barrick Declares Q1 Dividend • GlobeNewswire Inc. • 05/01/2024 09:59:00 AM
- Barrick Announces Election of Directors • GlobeNewswire Inc. • 04/30/2024 08:15:55 PM
- Barrick On Track to Achieve 2024 Targets • GlobeNewswire Inc. • 04/16/2024 11:00:00 AM
- Notice of Release of Barrick’s First Quarter 2024 Results • GlobeNewswire Inc. • 04/09/2024 11:00:00 AM
- Strategy-Driven Barrick Builds on Value Foundation • GlobeNewswire Inc. • 03/28/2024 09:20:38 PM
- Barrick Hunts New Gold and Copper Prospects in DRC From Kibali Base • GlobeNewswire Inc. • 03/20/2024 02:00:00 PM
- Barrick Opens Academy at Closed Buzwagi Mine • GlobeNewswire Inc. • 03/18/2024 08:00:00 AM
- Barrick to Grow Production and Value on Global Asset Foundation • GlobeNewswire Inc. • 03/15/2024 11:53:01 AM
- Loulo-Gounkoto Delivers Another Value-Creating Performance • GlobeNewswire Inc. • 03/10/2024 10:00:00 AM
- Passing of the Right Honorable Brian Mulroney • GlobeNewswire Inc. • 03/02/2024 01:17:35 AM
- Kibali and DRC Partner to Promote Local Content • GlobeNewswire Inc. • 03/01/2024 02:22:43 PM
- Tanzanian Parliamentary Committee Lauds Barrick’s Work at North Mara • GlobeNewswire Inc. • 02/23/2024 12:00:00 PM
- Form 6-K - Report of foreign issuer [Rules 13a-16 and 15d-16] • Edgar (US Regulatory) • 02/14/2024 10:28:08 PM
- Form 6-K - Report of foreign issuer [Rules 13a-16 and 15d-16] • Edgar (US Regulatory) • 02/14/2024 08:05:25 PM
- Clear Strategies and Strong Partnerships Set Barrick Up to Outperform, Says Bristow • GlobeNewswire Inc. • 02/14/2024 11:00:00 AM
- Barrick Announces New Share Buyback Program • GlobeNewswire Inc. • 02/14/2024 10:59:00 AM
- Barrick Declares Q4 Dividend • GlobeNewswire Inc. • 02/14/2024 10:58:00 AM
- NGM Strongly Positioned for Growth • GlobeNewswire Inc. • 02/10/2024 01:00:16 AM
- Form SC 13G - Statement of acquisition of beneficial ownership by individuals • Edgar (US Regulatory) • 02/08/2024 03:03:08 PM
- Form 6-K - Report of foreign issuer [Rules 13a-16 and 15d-16] • Edgar (US Regulatory) • 02/08/2024 12:46:55 PM
- Geologically Driven Asset Management Delivers Barrick’s Third Successive Year of Reserve Growth at Sustained Quality, While Unlocking Embedded Growth Portfolio • GlobeNewswire Inc. • 02/08/2024 12:00:00 PM
- Form SC 13G/A - Statement of acquisition of beneficial ownership by individuals: [Amend] • Edgar (US Regulatory) • 02/01/2024 06:04:56 PM
- Africa’s Largest Gold Mine Now Also One of Its Greenest • GlobeNewswire Inc. • 01/29/2024 04:00:00 PM
Bantec Engaged in a Letter of Intent to Acquire a Small New Jersey Based Manufacturing Company • BANT • May 1, 2024 10:00 AM
Cannabix Technologies to Deliver Breath Logix Alcohol Screening Device to Australia • BLO • Apr 30, 2024 8:53 AM
Hydromer, Inc. Reports Preliminary Unaudited Financial Results for First Quarter 2024 • HYDI • Apr 29, 2024 9:10 AM
Avant Technologies to Implement AI-Empowered, Zero Trust Architecture in Its Data Centers • AVAI • Apr 29, 2024 8:00 AM
Bantec Reports an Over 50 Percent Increase in Sales and Profits in Q1 2024 from Q1 2023 • BANT • Apr 25, 2024 10:00 AM
Cannabix's Breath Logix Alcohol Device Delivers Positive Impact to Private Monitoring Agency in Montana, USA • BLO • Apr 25, 2024 8:52 AM

