


| Followers | 679 |
| Posts | 140990 |
| Boards Moderated | 36 |
| Alias Born | 03/10/2004 |
Thursday, April 04, 2024 6:47:46 PM
By: Bruce Powers | April 4, 2024
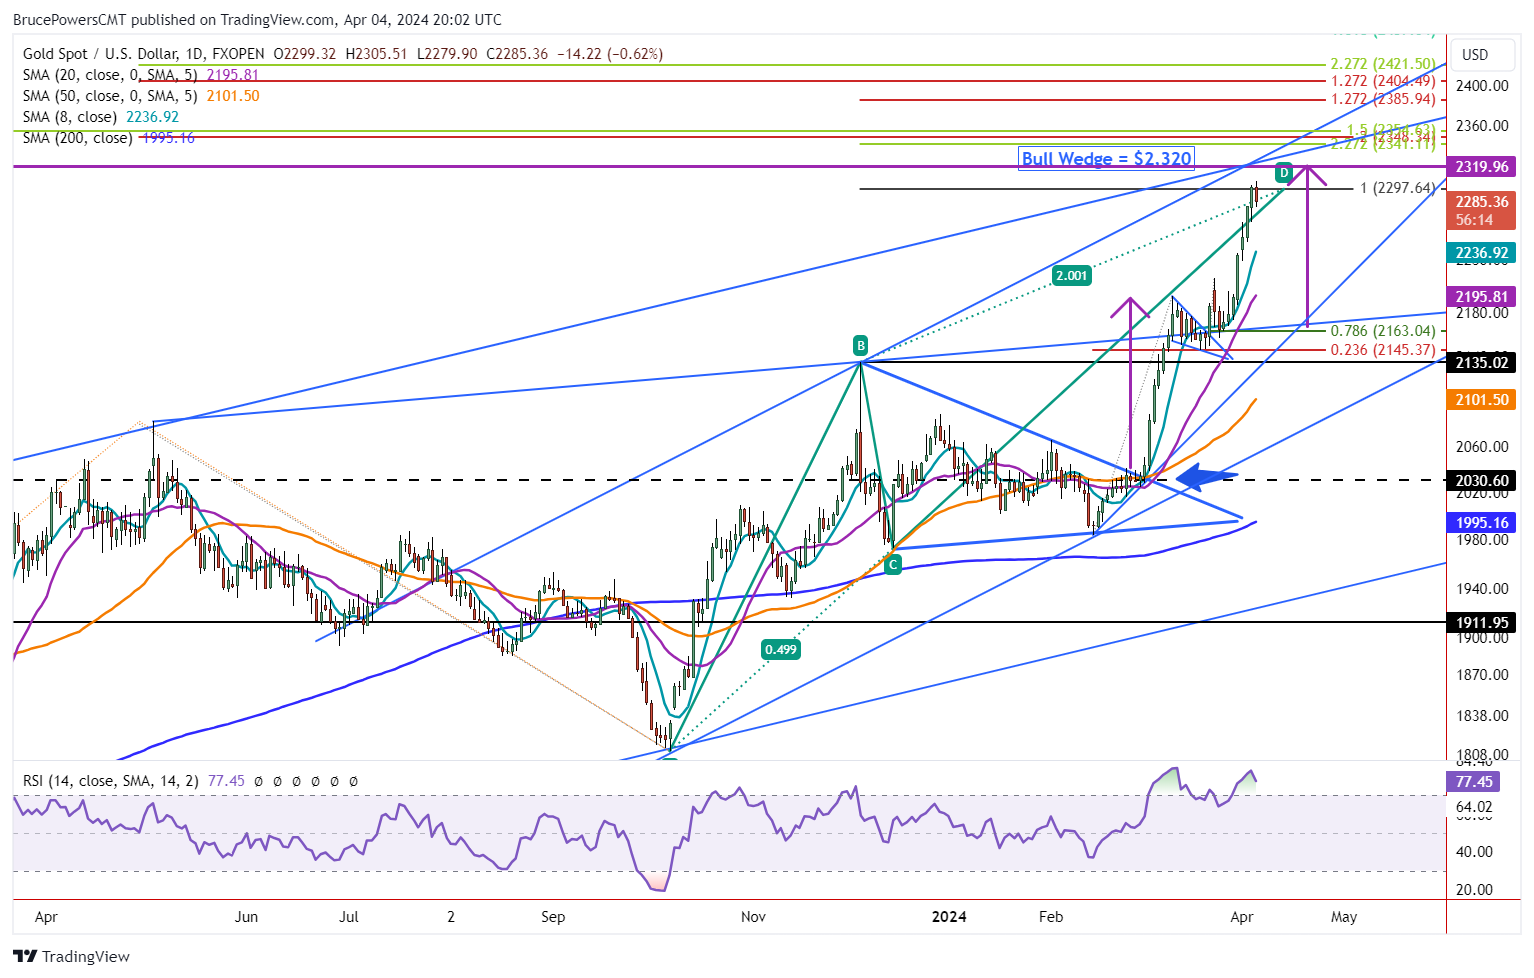
• Gold's rally pauses near 2,305, signaling potential pivot point and retracement ahead after completing ABCD pattern.
Gold stalled near trend highs today following a brief new record high of 2,305 reached earlier in Thursday’s trading session. It is on track to close in the red for the day but retains a series of higher daily highs and higher lows. Near-term support is at the day’s low of 2,283. If broken to the downside, a further retracement may be seen.
Pattern Target Reached
A key target of 2,298 was reached on Wednesday and today’s stall indicates the market seems to be aware of the price level. It completes the CD leg of a large rising ABCD pattern that reflects price symmetry with the AB leg of the pattern. The pattern begins from the swing low last October. As of today’s high, gold was up by 494 points or 27.3% from that low.
Also, it was up by 372 points or 13.6% from the recent symmetrical triangle breakout day low from February 29. Given the long-term nature of this pattern, gold has reached a potential pivot level that could lead to a retracement and end the current sharp advance, at least for the near-term. This doesn’t mean it will do that, just that it is at a decision point.
Next Higher Target is 2,320
Moreover, an advance above today’s high of 2,305, at the time of this writing, indicates the next higher target zone may be reached in the current advance. It comes in a little higher at 2,320. That target is identified as the initial target from the recent bullish falling wedge correction that ended with a minor swing low on March 18. It can be thought of as a measured move. The measured moves are marked with rising purple arrows.
Support Levels if Pullback Triggers
If a correction begins it could be a short term or longer retracement. Some potential support levels to watch include this week’s low at 2,228, followed by the most recent swing high and top of the wedge of 2,195. We may also see a similar pullback to what happened during the two-week correction that formed the falling wedge. It wouldn’t be surprising given the long-term base breakout that confirmed last week.
Read Full Story »»»
 DiscoverGold
Information posted to this board is not meant to suggest any specific action, but to point out the technical signs that can help our readers make their own specific decisions. Caveat emptor!
• DiscoverGold
Recent GOLD News
- Barrick Announces Extensive Exploration Partnership with Geophysx Jamaica • GlobeNewswire Inc. • 05/01/2024 10:15:00 AM
- Barrick to Ramp Up Production As It Remains On Track to Achieve 2024 Targets • GlobeNewswire Inc. • 05/01/2024 10:00:00 AM
- Barrick Declares Q1 Dividend • GlobeNewswire Inc. • 05/01/2024 09:59:00 AM
- Barrick Announces Election of Directors • GlobeNewswire Inc. • 04/30/2024 08:15:55 PM
- Barrick On Track to Achieve 2024 Targets • GlobeNewswire Inc. • 04/16/2024 11:00:00 AM
- Notice of Release of Barrick’s First Quarter 2024 Results • GlobeNewswire Inc. • 04/09/2024 11:00:00 AM
- Strategy-Driven Barrick Builds on Value Foundation • GlobeNewswire Inc. • 03/28/2024 09:20:38 PM
- Barrick Hunts New Gold and Copper Prospects in DRC From Kibali Base • GlobeNewswire Inc. • 03/20/2024 02:00:00 PM
- Barrick Opens Academy at Closed Buzwagi Mine • GlobeNewswire Inc. • 03/18/2024 08:00:00 AM
- Barrick to Grow Production and Value on Global Asset Foundation • GlobeNewswire Inc. • 03/15/2024 11:53:01 AM
- Loulo-Gounkoto Delivers Another Value-Creating Performance • GlobeNewswire Inc. • 03/10/2024 10:00:00 AM
- Passing of the Right Honorable Brian Mulroney • GlobeNewswire Inc. • 03/02/2024 01:17:35 AM
- Kibali and DRC Partner to Promote Local Content • GlobeNewswire Inc. • 03/01/2024 02:22:43 PM
- Tanzanian Parliamentary Committee Lauds Barrick’s Work at North Mara • GlobeNewswire Inc. • 02/23/2024 12:00:00 PM
- Form 6-K - Report of foreign issuer [Rules 13a-16 and 15d-16] • Edgar (US Regulatory) • 02/14/2024 10:28:08 PM
- Form 6-K - Report of foreign issuer [Rules 13a-16 and 15d-16] • Edgar (US Regulatory) • 02/14/2024 08:05:25 PM
- Clear Strategies and Strong Partnerships Set Barrick Up to Outperform, Says Bristow • GlobeNewswire Inc. • 02/14/2024 11:00:00 AM
- Barrick Announces New Share Buyback Program • GlobeNewswire Inc. • 02/14/2024 10:59:00 AM
- Barrick Declares Q4 Dividend • GlobeNewswire Inc. • 02/14/2024 10:58:00 AM
- NGM Strongly Positioned for Growth • GlobeNewswire Inc. • 02/10/2024 01:00:16 AM
- Form SC 13G - Statement of acquisition of beneficial ownership by individuals • Edgar (US Regulatory) • 02/08/2024 03:03:08 PM
- Form 6-K - Report of foreign issuer [Rules 13a-16 and 15d-16] • Edgar (US Regulatory) • 02/08/2024 12:46:55 PM
- Geologically Driven Asset Management Delivers Barrick’s Third Successive Year of Reserve Growth at Sustained Quality, While Unlocking Embedded Growth Portfolio • GlobeNewswire Inc. • 02/08/2024 12:00:00 PM
- Form SC 13G/A - Statement of acquisition of beneficial ownership by individuals: [Amend] • Edgar (US Regulatory) • 02/01/2024 06:04:56 PM
- Africa’s Largest Gold Mine Now Also One of Its Greenest • GlobeNewswire Inc. • 01/29/2024 04:00:00 PM
Bantec Engaged in a Letter of Intent to Acquire a Small New Jersey Based Manufacturing Company • BANT • May 1, 2024 10:00 AM
Cannabix Technologies to Deliver Breath Logix Alcohol Screening Device to Australia • BLO • Apr 30, 2024 8:53 AM
Hydromer, Inc. Reports Preliminary Unaudited Financial Results for First Quarter 2024 • HYDI • Apr 29, 2024 9:10 AM
Avant Technologies to Implement AI-Empowered, Zero Trust Architecture in Its Data Centers • AVAI • Apr 29, 2024 8:00 AM
Bantec Reports an Over 50 Percent Increase in Sales and Profits in Q1 2024 from Q1 2023 • BANT • Apr 25, 2024 10:00 AM
Cannabix's Breath Logix Alcohol Device Delivers Positive Impact to Private Monitoring Agency in Montana, USA • BLO • Apr 25, 2024 8:52 AM

