


| Followers | 680 |
| Posts | 141122 |
| Boards Moderated | 36 |
| Alias Born | 03/10/2004 |
Monday, April 01, 2024 5:17:03 PM
By: Bruce Powers | April 1, 2024
• Silver's recent rally signals potential for further gains, but resistance levels and support zones indicate caution amidst bullish sentiment.
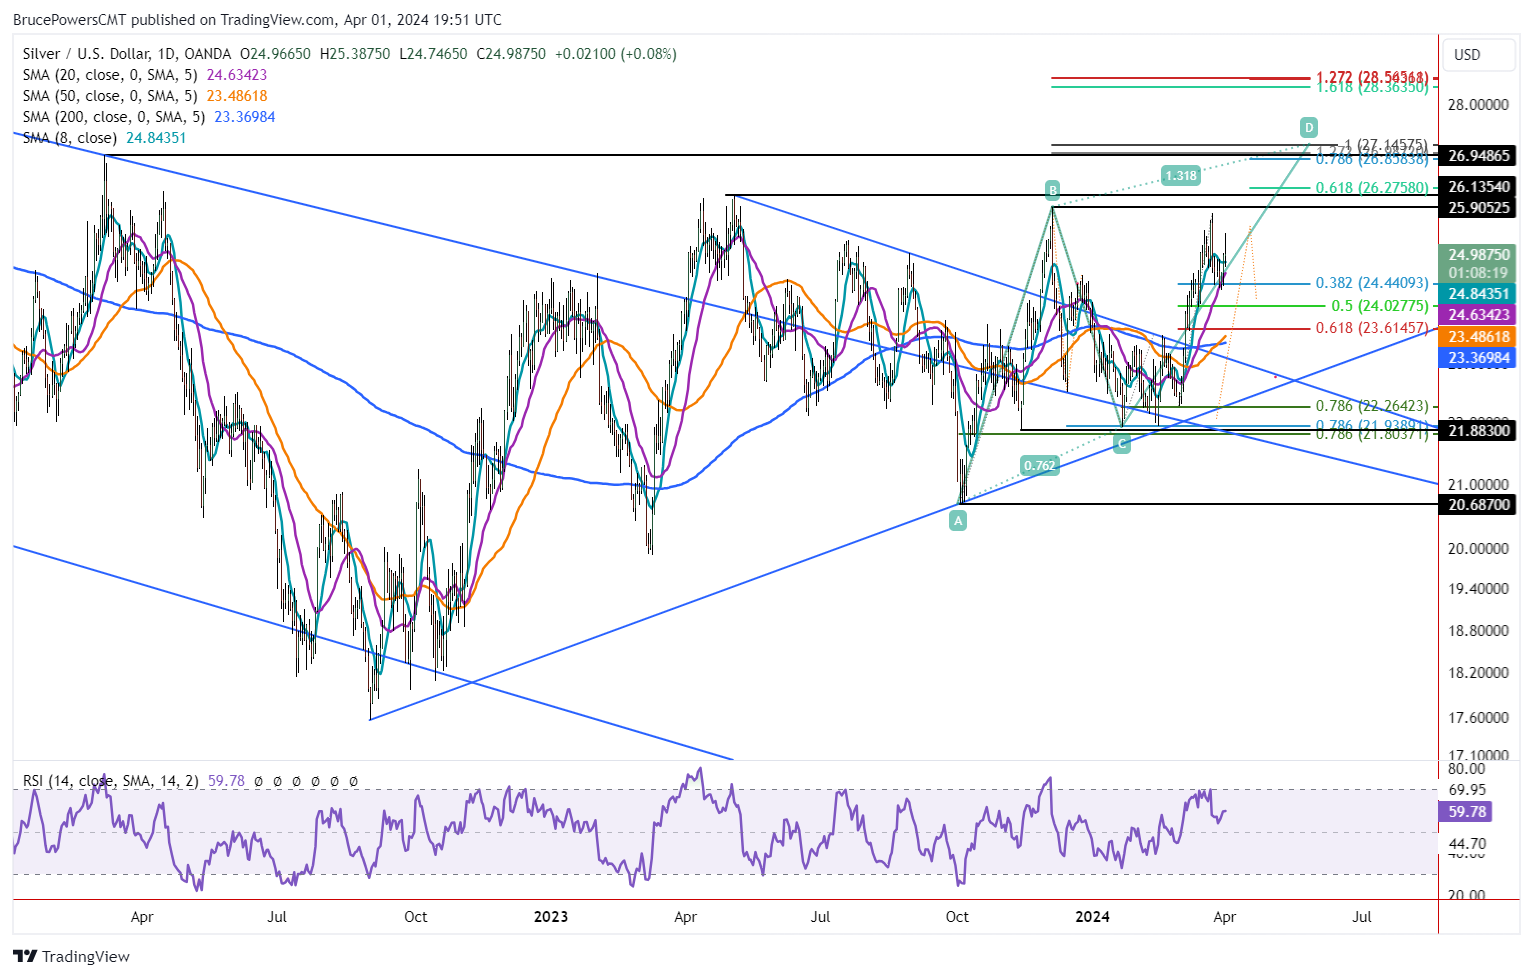
Silver pulled back to support last week around the 38.2% Fibonacci retracement and 20-Day MA with a low of 24.33. It was followed by an advance Friday and again today, Monday. Monday’s rally triggered a bullish weekly breakout above last week’s high of 25.01. Resistance was seen at a 25.39 high before silver pulled back. It looks like it should close above the 8-Day MA again today, after doing so on Friday. Given today’s intraday pullback, silver is set to close relatively weak, below the halfway point of the day’s trading range and near the opening price.
Pullback Follows 15.7% Advance
Nevertheless, silver rallied by 3.50 points or 15.7% in the 16 days prior to the recent 25.78 peak, showing new enthusiasm for the precious metal. That peak was just below the swing high from December 4 (B) at 25.91. The more significant previous swing high was at 26.14, as it better defines the price structure of the developing uptrend. A daily close above 26.14 will provide a higher swing high and further confirm strengthening of the trend. It is the next key resistance level to be recaptured. Once exceeded, silver should be freed up to confront higher swing target levels starting with 26.95 from March 2022.
Higher Target of 27.15
Notice the higher long-term target on the chart at 27.15. A large ascending ABCD pattern is completed there as there is symmetry between the first and second legs of the pattern. It begins at the October 2023 swing low of 20.69. Notice that the 27.15 target is slightly higher than the March 2022 swing high. Together, they can be watched as an eventual target zone from 26.95 to 27.15.
Short-term Caution Due to Weak Close
Regardless of the bullish outlook, until there is a rally above 25.78 swing high, the chance for a deeper retracement remains. Especially, given the weak close likely on Monday. Lower Fibonacci retracement levels are marked on the chart and the critical 50-Day and 200-Day MAs are at 23.48 and 23.37, respectively. A drop below today’s low of 24.75 would give the first sign of weakness. However, until there is a drop below the 24.33 swing low there is no clear sign of a continued pullback.
Read Full Story »»»
 DiscoverGold
Information posted to this board is not meant to suggest any specific action, but to point out the technical signs that can help our readers make their own specific decisions. Caveat emptor!
• DiscoverGold
FEATURED Cannabix Technologies Launches New Compact Breath Logix Workplace Series and Prepares for Delivery to South Africa • May 7, 2024 8:51 AM
Moon Equity Holdings, Corp. Announces Acquisition of Wikolo, Inc. • MONI • May 7, 2024 9:48 AM
NanoViricides Reports that the Phase I NV-387 Clinical Trial is Completed Successfully and Data Lock is Expected Soon • NNVC • May 2, 2024 10:07 AM
ILUS Files Form 10-K and Provides Shareholder Update • ILUS • May 2, 2024 8:52 AM
Avant Technologies Names New CEO Following Acquisition of Healthcare Technology and Data Integration Firm • AVAI • May 2, 2024 8:00 AM
Bantec Engaged in a Letter of Intent to Acquire a Small New Jersey Based Manufacturing Company • BANT • May 1, 2024 10:00 AM

