Register for free to join our community of investors and share your ideas. You will also get access to streaming quotes, interactive charts, trades, portfolio, live options flow and more tools.
Hi Clive, Re: Retirement...
Yes, I retired as of January of this year. I was in my 15th year of a 5 year commitment!!!!!
Succession Planning is important.
Best wishes,
OAG Tom
Hi Tom
I read this book and wrote this review a long time ago. It's still a good review and the book's interpretation is still valid.
https://web.archive.org/web/20120830055138id_/http://www.aim-users.com/books.htm#b6
Oh, and substitute v-Wave for IW in the write-up.............
v-WAVE 3.0*
Suggested Starting Cash Value For New AIM Accounts/Positions
Individual Stocks
High Risk: At or above 51%
Neutral: Between 37 and 50%
Low Risk: At or below 36%
Diversified Funds
High Risk: At or above 34%
Neutral: Between 25 and 33%
Low Risk: At or below 24%
_________________________
Week of July 26th
_________________________
Short Term (18 Months)
Individual Stocks: 67% (Up 2 from previous week)
Diversified Mutual Funds or Portfolio: 45% (Up 2 from previous week)
__________________________
Long Term (3-5 Years)
Individual Stocks: 49% (Up 1 from previous week)
Diversified Mutual Funds
or Portfolio: 33% (Up 1 from previous week)
Oscillator: 1.01 (Up 1.32 from previous week)
*See posts #44585 and #44588
v-WAVE 3.0*
Suggested Starting Cash Value For New AIM Accounts/Positions
Individual Stocks
High Risk: At or above 51%
Neutral: Between 37 and 50%
Low Risk: At or below 36%
Diversified Funds
High Risk: At or above 34%
Neutral: Between 25 and 33%
Low Risk: At or below 24%
_________________________
Week of July 19th
_________________________
Short Term (18 Months)
Individual Stocks: 65% (Up 3 from previous week)
Diversified Mutual Funds or Portfolio: 43% (Up 2 from previous week)
__________________________
Long Term (3-5 Years)
Individual Stocks: 48% (Unchanged from previous week)
Diversified Mutual Funds
or Portfolio: 32% (Unchanged from previous week)
Oscillator: -.31 (Down .02 from previous week)
*See posts #44585 and #44588
It's been nice to have some selling activity recently.
Sold 5% of AAPL
Sold 5% of PIZ
Sold 5% if RPG
Sold 5% of DLN.
A nice string of sales has me feeling pretty good right now. The Sales Dept is happy as is the Savings and Loan Dept.
Best wishes,
OAG Tom
Well WPM hit my strike price the end of last month but I wanted to wait till the beginning of the month to do my trades.
Then it made me nervous as it dropped. Not that I thought it would drop much but I really want to raise cash.
Anyway, today it went above my sell signal and I sold shares at $57.75. The rest are covered by options and will have to wait till.january to sell more. I expect some will be called.
Toofuzzy
v-WAVE 3.0*
Suggested Starting Cash Value For New AIM Accounts/Positions
Individual Stocks
High Risk: At or above 51%
Neutral: Between 37 and 50%
Low Risk: At or below 36%
Diversified Funds
High Risk: At or above 34%
Neutral: Between 25 and 33%
Low Risk: At or below 24%
_________________________
Week of July 12th
_________________________
Short Term (18 Months)
Individual Stocks: 62% (Unchanged from previous week)
Diversified Mutual Funds or Portfolio: 41% (Unchanged from previous week)
__________________________
Long Term (3-5 Years)
Individual Stocks: 48% (Unchanged from previous week)
Diversified Mutual Funds
or Portfolio: 32% (Unchanged from previous week)
Oscillator: -.33 (Down .03 from previous week)
*See posts #44585 and #44588
Hi 1979, Re: Book...............
It's a quick book to read. I found it interesting and had also read Sun Tsu's original Art of War. I found the mindset of the shorter term trader to be well described. Considering the length of time our AIM holdings usually are, we aren't part of the ST Trader pool. But, they end up being our Customers and Suppliers as we run our Equity Warehouse businesses. So, understanding their motives and actions helps.
I also found that using the book's main topics of being one's own boss, devising a strategy, gathering information, adapting to the situation and plan execution all made sense with Mr. Lichello's AIM. We do these things even if we don't know it.
I read this book while on a spring vacation over 20 years ago. As I read it I started jotting down notes. My review of the book is the result of those notes.
Enjoy the book!
Happy Financial Independence Day!,
OAG Tom
Thanks Tom!!
It hasn't been reviewed since 2020. Of the reviews, 1 person out of 17 didn't like it. I ordered a copy based on your advice.
I read this book and wrote this review a long time ago. It's still a good review and the book's interpretation is still valid.
https://web.archive.org/web/20120830055138id_/http://www.aim-users.com/books.htm#b6
Oh, and substitute v-Wave for IW in the write-up.............
Best wishes,
OAG Tom
The first half of the year comes in positive, but not by great amounts. Here's the image summaries:
Simple IRA (converted from Twinvest to AIM in January, 2024)

(Cash Reserve = 24%)
US Business Sector ETF Composite

(Cash Reserve = 15%)
Tom's 10 Common Stock Composite

(Cash Reserve = 17% and reflects the Required Minimum Distribution for 2024
YTD results before distribution = 7.75%)
International Style-type ETF Composite

(Cash Reserve = 20%)
Cash levels improved while monthly performance varied. Overall, in a tricky year, I feel good about AIM's guidance so far.
Happy Independence Day and also Happy Financial Independence,
OAG Tom
v-WAVE 3.0*
Suggested Starting Cash Value For New AIM Accounts/Positions
Individual Stocks
High Risk: At or above 51%
Neutral: Between 37 and 50%
Low Risk: At or below 36%
Diversified Funds
High Risk: At or above 34%
Neutral: Between 25 and 33%
Low Risk: At or below 24%
_________________________
Week of July 5th
_________________________
Short Term (18 Months)
Individual Stocks: 62% (Unchanged from previous week)
Diversified Mutual Funds or Portfolio: 41% (Unchanged from previous week)
__________________________
Long Term (3-5 Years)
Individual Stocks: 48% (Unchanged from previous week)
Diversified Mutual Funds
or Portfolio: 32% (Unchanged from previous week)
Oscillator: -.36 (Down .02 from previous week)
*See posts #44585 and #44588
Hi W, Re: Lichello Financial Leadership........
I've not heard of it and the web site requires a phone call to gain access to information on it.
Sorry,
OAG
Has anyone heard of the Lichello Financial Leadership Foundation?
v-WAVE 3.0*
Suggested Starting Cash Value For New AIM Accounts/Positions
Individual Stocks
High Risk: At or above 51%
Neutral: Between 37 and 50%
Low Risk: At or below 36%
Diversified Funds
High Risk: At or above 34%
Neutral: Between 25 and 33%
Low Risk: At or below 24%
_________________________
Week of June 28th
_________________________
Short Term (18 Months)
Individual Stocks: 62% (Unchanged from previous week)
Diversified Mutual Funds or Portfolio: 41% (Unchanged from previous week)
__________________________
Long Term (3-5 Years)
Individual Stocks: 48% (Unchanged from previous week)
Diversified Mutual Funds
or Portfolio: 32% (Unchanged from previous week)
Oscillator: .38 (Down .04 from previous week)
*See posts #44585 and #44588
rosenw
Sounds like there were some splits along the way.
1) Decide if you are presently more bullish or bearish.
2) Use original cost basis or current price based on above.
3) If cost basis is way lower, start with zero cash and the first sale will provide your cash reserve.
But I'm
Toofuzzy
Hi Tom
My dad fought in WW2 also. Not much action but behind enemy lines at least once. He did printing of some sort.
He had to try riding a motorcycle once, got scared when he let out the clutch with too much gas I guess and jumped off. I guess he got out of that duty .
His brother, my uncle was in the Navy.
v-WAVE 3.0*
Suggested Starting Cash Value For New AIM Accounts/Positions
Individual Stocks
High Risk: At or above 51%
Neutral: Between 37 and 50%
Low Risk: At or below 36%
Diversified Funds
High Risk: At or above 34%
Neutral: Between 25 and 33%
Low Risk: At or below 24%
_________________________
Week of June 21st
_________________________
Short Term (18 Months)
Individual Stocks: 62% (Down 3 from previous week)
Diversified Mutual Funds or Portfolio: 41% (Down 2 from previous week)
__________________________
Long Term (3-5 Years)
Individual Stocks: 48% (Down 1 from previous week)
Diversified Mutual Funds
or Portfolio: 32% (Down 1 from previous week)
Oscillator: -.42 (Down 1.37 from previous week)
*See posts #44585 and #44588
Many thanks, Tom - much appreciated.
Hi rosenw - If you weren't AIMing the stock until now, I'd suggest just setting it up as an AIM "portfolio" starting with your 191 shares of stock at its current price and an equivalent amount of cash that you're planning to invest in it over time. (If you plan to adjust your recommended cash percentage based on the vWave, as many here do, you would allocate 49% of the total portfolio value to cash, based on the current vWave level. If I recall, "Classic AIM" would give you a 50/50 allocation of cash to stock, so both ways would come out more or less the same right now.)
With kind regards,
MIJ
I want to convert a stock that I previously bought and subsequently sold portions of over the years to A.I.M. How should I factor in those prior sells so I can start fresh in regards to staring price and cash reserve values?
Here is an example of what I'm talking about:
Bought 100 shares on 2/13/2007 @ $10.00
Sold 100 share @24.685 on 9/7/2017
Sold 314 share @24.6701 on 9/7/2017
Sold 362 share @35.00 on 9/18/2020
Sold 37 shares @35.10 on 10/8/2020
===============================================================
Sold total 809 shares at an average price of $29.77146724351051
===============================================================
191 shares remaining
Thanks.
Hi MIJ, Re: Fosback's High/Low Logic Index......................
I pull data from Barron's on a weekly basis. Mr. Fosback based his in the NYSE originally. Since Barron's had it for the NYSE and NASDAQ, I chose to combine both for my "Divergence Index." It works the same as Mr. Fosback's HLLI with it looking at both the number or new highs and lows and taking the Smaller of the values as a percentage of all issues traded in the week. There are weeks when NYSE and NASDAQ are in sync and some weeks when they're moving differently. In total, it works pretty well with the combo.
BARRON'S has been very consistent over the years. I have data from 1982 on to this week. It's an effective sentiment indicator, but is a bit fickle and can change direction quickly. Most libraries will have Barron's available. I subscribe to the On Line version as it saves me about a 10 mile drive (each way).
Hope this helps,
OAG Tom
Tom - re: the High/Low Logic Index, can I ask you where you're sourcing your data?
I've been wanting to explore the HLLI but don't know of a good source for historical NH/NL data offhand. If I'm not mis-remembering, there were some quirks in how the data were being reported (some change over time affecting the first few weeks of a given year?), and I'd be curious about how you're handling that (if I remembered it correctly in the first place).
Thanks as always!
.....and an Image to go along with the data..................

Indexes were up even while market breadth was lower. Also, the number of new highs and lows over the previous 52 weeks was higher making the Fosback High/Low Logic Index bearish. Valuations are still lofty, too. This puts the dividend yield of stocks a bit below their average.
Keep some Powder dry,
OAG Tom
Of course he was!
And that he lived a good long life after going through all of that is a testament of how important a positive attitude is to to a long life.
v-WAVE 3.0*
Suggested Starting Cash Value For New AIM Accounts/Positions
Individual Stocks
High Risk: At or above 51%
Neutral: Between 37 and 50%
Low Risk: At or below 36%
Diversified Funds
High Risk: At or above 34%
Neutral: Between 25 and 33%
Low Risk: At or below 24%
_________________________
Week of June 14th
_________________________
Short Term (18 Months)
Individual Stocks: 65% (Unchanged from previous week)
Diversified Mutual Funds or Portfolio: 43% (Unchanged from previous week)
__________________________
Long Term (3-5 Years)
Individual Stocks: 49% (Unchanged from previous week)
Diversified Mutual Funds
or Portfolio: 33% (Unchanged from previous week)
Oscillator: .95 (Down .08 from previous week)
*See posts #44585 and #44588
He was a nice man. He was a CPA, so not the Rambo type. He was more than a decade older than my parents, who were also WWII vets.
Wow!
You uncle truly was a patriot!
Hi Toof,
We paid a price for that war in human loss and then paid for it again years later in inflation.
I guess there's no free lunch served with government overspending; Domino Effect or not.
Watching the WWII Vets in Normandy this week was eye opening. My uncle attempted to enlist 3 times in his 30s. He had just one lung (from pre-antibiotic pneumonia) and was turned away. Then, they drafted him anyway! He was one of many who stormed ashore at Normandy. He was 36 at the time. He lived and continued on until the war's conclusion. He lived into his late 80s.
Best wishes,
OAG Tom
I wonder what out economy would be like if we never entered the Viet Nam war.
No.reason as the Vietnamese hated the Chinese.
But I wonder if the Johnson social programs would have passed if Kennedy wasn't shot.
Toofuzzy
Hi Tom
It has been a long weight on DHT. Because of it's extreme cyclicality I hope to totally sell out eventually.
Toofuzzy
Guess what! Another month has passed and along with it the first half of 2024. Here's where my AIM portfolios stand:
My 9 "Style" International ETF Portfolio:

My U.S. Business Sector ETF Portfolio (mostly Equal Cap Weight Sectors)

My 10 Common Stock Portfolio

My Retirement Account (after required distributions)

May turned out to be a pretty good month overall. Cash is slowly rebuilding as stocks and ETFs rise.
Best wishes,
OAG Tom
Hi Jon
Good advice Jon. Thanks
So we spent all of last week at S Padre Island with our son and his family.
Didn't crack the book, but I had it with me!
Hi LongTimeAIMer,
Wow, I completely missed that bit of news. I've been busy porting all my regular software and apps from my 2014 laptop (main) computer over to a new one. So many passwords, so little time!!
There's a couple of software programs I may not be able to use again. I'm having trouble finding license IDs on stuff I've used for two decades! The one company still maintains a web presence and I've written to them. I'll just have to wait and see if their records are good!
I hope this didn't cause Warren any heart palpitations!
Best wishes,
OAG Tom
I know it's not normally done here but, On my X Twitter Feed today was this little gem.
Quoted from Yahoo FInance, the Stock was halted at 185.10 USD down -627,214.90
"A technical glitch on the New York Stock Exchange shortly after the market open on Monday temporarily showed incorrect stock prices or volatility halts on several stocks, most notably a 99.9% drop in the price of Warren Buffett's Berkshire Hathaway (BRK-A) A-shares.
Berkshire Hathaway (BRK-B) B-shares, which trade at 1/1,500th the price of the A-shares, were down as much as 1.1% on Monday and appeared largely unaffected by the error, though volatility was pronounced in both issues as A-shares reopened for trading near 11:35 a.m. ET.
A NYSE spokesperson later said "a technical issue involving industry-wide price bands published by the Consolidated Tape Association’s Securities Information Processor triggered “limit-up/limit down” trading halts on up to 40 symbols listed on NYSE Group exchanges.
Price bands on securities prevent outsized volatility or extreme movements. The spokesperson said shortly before noon, the issue was resolved and trading in the impacted stocks resumed."
Buy from the scared ???
Correction:
Euronet symbol is EEFT
OAG
Hi JD, Re: v-Wave in living color...........................

It seems Earnings need to grow or interest rates and inflation need to drop for the markets to move much beyond where they are currently.
On a different topic, Value Line dropped SBUX from their 3-5 year growth model and replaced it with Euronet Worldwide (EEET). See the updated list of long term growth stocks here:
https://investorshub.advfn.com/boards/read_msg.aspx?message_id=174532376
Best wishes,
OAG Tom
v-WAVE 3.0*
Suggested Starting Cash Value For New AIM Accounts/Positions
Individual Stocks
High Risk: At or above 51%
Neutral: Between 37 and 50%
Low Risk: At or below 36%
Diversified Funds
High Risk: At or above 34%
Neutral: Between 25 and 33%
Low Risk: At or below 24%
_________________________
Week of June 7th
_________________________
Short Term (18 Months)
Individual Stocks: 65% (Unchanged from previous week)
Diversified Mutual Funds or Portfolio: 43% (Unchanged from previous week)
__________________________
Long Term (3-5 Years)
Individual Stocks: 49% (Unchanged from previous week)
Diversified Mutual Funds
or Portfolio: 33% (Unchanged from previous week)
Oscillator: 1.03 (Down .08 from previous week)
*See posts #44585 and #44588
Value Line is late on this week's issue.
I will post the numbers as soon as they are released.
Jon
Hi JD, Re: v-Wave histogram.....................

The best I can make of this is "steady." I'm glad Mr. Lichello has been coaching me in 2024 on reducing some inventory as prices have risen. Now we're almost finished with the not very busy "Sell In May" crowd and I'm not sure what to expect for June.
Best wishes,
OAG Tom
v-WAVE 3.0*
Suggested Starting Cash Value For New AIM Accounts/Positions
Individual Stocks
High Risk: At or above 51%
Neutral: Between 37 and 50%
Low Risk: At or below 36%
Diversified Funds
High Risk: At or above 34%
Neutral: Between 25 and 33%
Low Risk: At or below 24%
_________________________
Week of May 31st
_________________________
Short Term (18 Months)
Individual Stocks: 65% (Unchanged from previous week)
Diversified Mutual Funds or Portfolio: 43% (Unchanged from previous week)
__________________________
Long Term (3-5 Years)
Individual Stocks: 49% (Unchanged from previous week)
Diversified Mutual Funds
or Portfolio: 33% (Unchanged from previous week)
Oscillator: 1.11 (Down .09 from previous week)
*See posts #44585 and #44588
Steve..
And remember to subtract your age from 100. That determines how many pages you should read before you decide whether or not you should finish the book. 😎
Take care.
Jon
Tom:
Don't be surprised if you get a bit upset by the histories presented relative to the FED, monetary policy and other such subjects
Thanks for the heads up!
At our age, we need to watch out for potential blood pressure spikes! 😉
Hi Steve, Re: Dreman's book.............
I hope you enjoy it and get some goods out of it.
Don't be surprised if you get a bit upset by the histories presented relative to the FED, monetary policy and other such subjects!!!
OAG
Hi Tom.
RE: Dreman's new book...
Book was delivered last night!
'I found I had to read a section and then digest it for a few hours before moving onto the next. So, it took a while to get through the entire book.'
My review will probably take awhile as well given that it's 480 pages long; inclusive of the substantial notes, references and index.
😲
|
Followers
|
309
|
Posters
|
|
|
Posts (Today)
|
0
|
Posts (Total)
|
47155
|
|
Created
|
01/29/02
|
Type
|
Free
|
| Moderator OldAIMGuy | |||
| Assistants The Grabber Toofuzzy | |||
Here's a handy "Quick AIM Calculator" for finding the next AIM directed Buy and Sell prices for your portfolio holdings:
A.I.M. Users Bulletin Board (AIMUSERS): Thanks LC, Now they can use the "calculator" again! (advfn.com)
While the AIM book is no longer being reprinted, it is available from Amazon for their Kindle for $5.99.
http://www.amazon.com/How-Make-Stock-Market-Automatically-ebook/dp/B002VKJ1EI/ref=sr_1_1?s=books&ie=UTF8&qid=1395757939&sr=1-1&keywords=lichello
Mr. Lichello wrote the book on AIM in 1977. In the mid-'80s he put an infomercial on AIM on late night TV and attempted to sell his workbook and audio tapes.
(1) How To Make $1Million In The Stockmarket Infomercial - 1985 - YouTube
It's a reasonable review of the AIM method for those who are unfamiliar.

Run A Successful Equity Warehouse
Welcome to the AIM Users Bulletin Board. This is the thread to post your thoughts, questions and comments on the use of Robert Lichello's Automatic Investment Management for handling the risk of being involved in the Equities markets.
The AIM strategy gives the user LIFO gains of 20% minimum if the method is followed "by the book." It is ideally suited to those seeking long term investment growth while managing the risk of being invested.
Thoughts on being a successful Individual Investor
I wrote this book review a long time ago. It's a trader's interpretation of
Sun Tzu's "Art Of War." I related it to AIM as best I could.
------------------------------------------------------------------------
Mr. Lundell says, "Today's financial markets are the last bastion of unabashed conflict.....
To participate, you must be your own general, devising a strategy, gathering information, executing your plan, and adapting to the situation."
How can we use AIM and the v-Wave for strategic and tactical planning to carry out Mr. Lundell’s requirements to participate in the Equity Markets?
"Be your own general"
You are in charge. You are responsible. When you win, you benefit. When you lose, only you are to blame.
a) Broad trends persist. Discover them. They will survive boom and bust.
b) Don't contemplate engaging in war while beholden to another. They could become your ruler!
To me this means "Stay away from Margin Buying unless you are certain of victory."
c) Establish and maintain a "Baseline of Survival" for your command.
This is the "income" side of my overall portfolio.
d) Know that reality is governed by Darwinism; Long Term Survival belongs to the fittest.
"Devise a Strategy"
Our strategy is to sell inventory into market strength and to buy into market weakness. Robert Lichello's AIM algorithm provides us with a systematic approach to follow that employs this strategy.
a) Sell quality merchandise to all those willing to pay.
b) Buy quality merchandise when the price offers reasonable hope to resell at a profit.
c) Let the allocation of resources and inventory be governed by the course of the market and AIM's guidance.
"Gather Information"
Today there is no excuse for not being informed.
a) Differentiate between information VOLUME and QUALITY.
b) Differentiate between FACTS and OPINION.
c) Find good sources of judgement where you cannot act as judge.
d) Information is trusted only when provided by those proved trustworthy.
"Adapt to the Situation at Hand"
The v-Wave measures general U.S. Market Risk (and may be sensitive to world market risk) from low to average to high. This helps you gauge the situation by:
a) Gauging your initial cash reserve requirements on new investments
b) Gauging your on-going cash reserve requirements on established investments
c) Judging whether to establish a bias for accumulation or distribution
d) Possibly starting no new AIM accounts when the v-Wave is showing High Risk
e) Possibly ignoring all AIM Buy Signals during v-Wave High Risk events.
f) Following all AIM buy and sell signals during v-Wave Average Risk events
g) Possibly ignoring all AIM Sell signals during v-Wave Low Risk events
h) Re-assessing your "Baseline For Survival" at times when AIM has your account heavily in Cash
i) Always attempting to beat measured inflation by 5 basis points minimum after all taxes and living expenses are paid. If you do this consistently, in good and bad markets, you will be winning long term
j) Possibly using "vealies" when your positions are cash rich relative to the v-Wave. Limiting supply helps to keep Momentum player’s Demand high.
"Execute your Plan"
Set the plan in motion; know that it takes time for realization. Follow the plan without hesitation allowing the goals to be realized. The strategy is sound so execution is all that is required.
a) Buy when the plan says
b) Sell when the plan says
c) Be very patient when no buy or sell signals are being generated
Reading Mr. Lundell's interpretation of Sun Tzu's work will help you focus on your own plan. It will arm you with knowledge of what others not using AIM are doing in the market. Understanding Short Term Trader's strategy and tactics is like having a spy in the enemy's camp. AIM users can profit by knowing just how these people think and act. AIM acts as almost a mirror image of what goes on in a trader's mind.
-------------------------------------------------------------------------------------------------------------
The v-Wave........
Mr. Lichello used fixed cash starting levels; first it was 50/50 then 67/33 and in the last edition of his book 80/20 for the Equity/Cash ratio. This "one size fits all" approach is like a broken watch that shows the correct time twice a day but is wrong the rest of the time!
Minstrlman, a regular contributor here, helped gather data from Value Line and formed a highly capable risk-cash indicator for our use. Since then, J Derb continued his work each week. As an adjunct to the AIM methodology we now have a Cash Indicator which helps guide our starting and ongoing Cash Reserve level of AIM relative to measured market risk. It can be used as a general market barometer or specifically with the AIM method. The v-Wave (or VW) is derived from the Value Line "Appreciation Potential - Next 3-5 Years" (VLAP) indicator shown weekly in their Summary and Index Section for their 1700 stock edition. Looking back through V/L's history we find the peak Appreciation Potential occurred 12/23/1974 at +234%. Our continuous database starts January of 1982 and we scaled our "zero cash" to the market risk low point of early that year. We take the VLAP and manipulate it to get an indication of how much cash should be reserved for diversified mutual fund AIM accounts. It should be multiplied by your stock or portfolio's BETA to get the cash reserve level of less diversified or more aggressive holdings.
v-Wave Weekly Cash Reserve Indicator For AIM Users
Current years of the v-Wave:
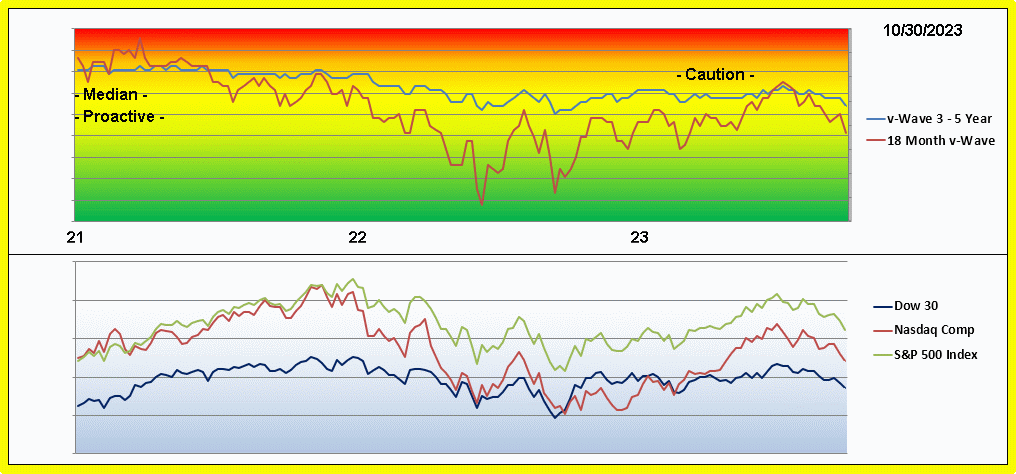
For diversified portfolios the Median value for the v-Wave is 29.5%. High Risk is 34% cash or higher for individual company stocks. Low Risk is 24% cash or lower.
To get a more proper cash level for individual company stocks multiply the current "Diversified" value by 1.5. This gives us 51% as the high risk threshold and 36% for the low risk boundary.
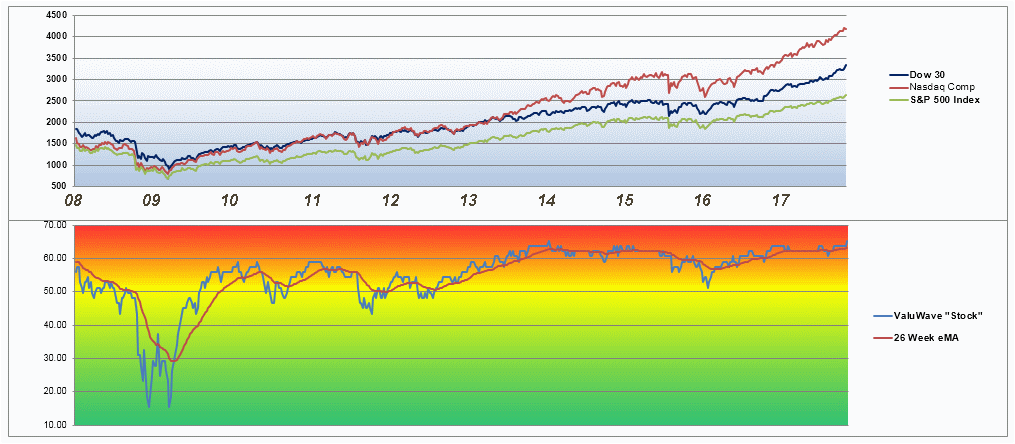
Looking at the cumulative risk of the v-Wave gives another perspective:
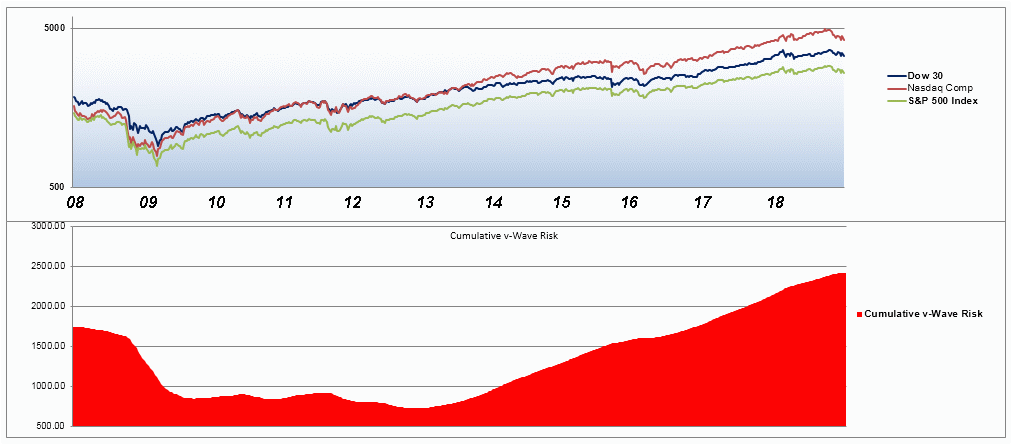
Cumulative v-Wave is calculated by taking each week's v-Wave Stock value, subtracting the median value from it and adding it to the previous total.
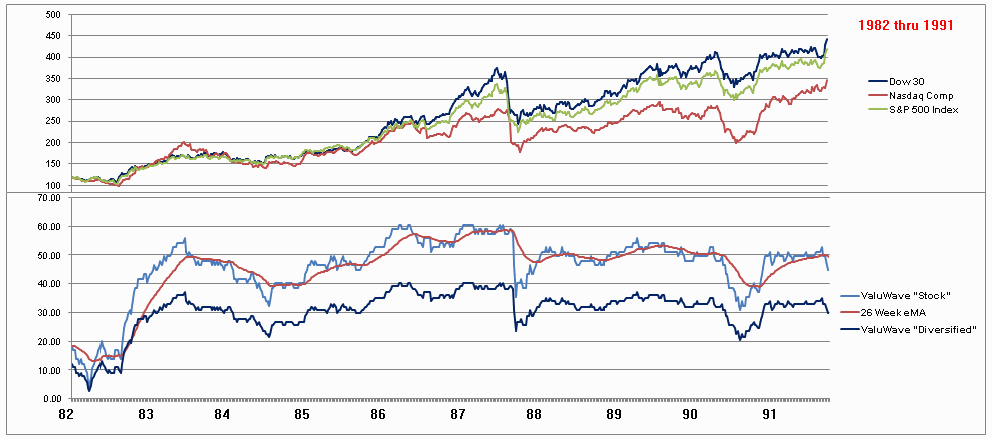
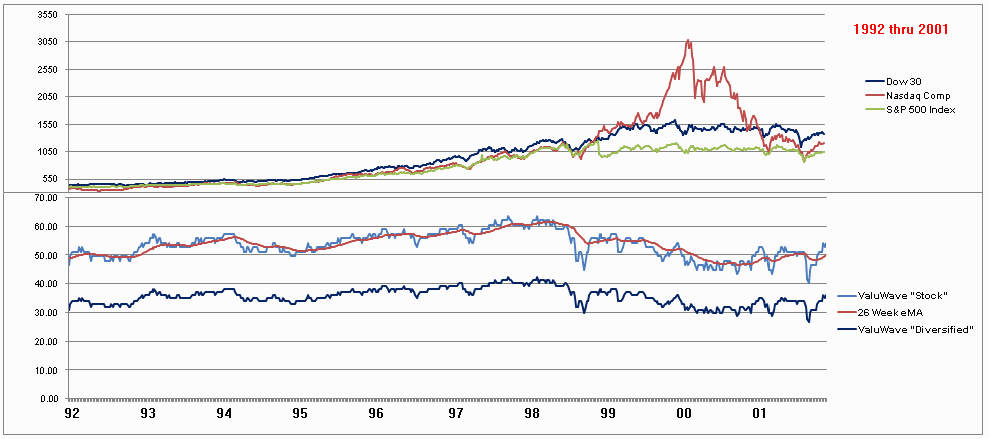
Significant historical events are shown nicely here and the v-Wave's response at those times.
v-Wave Calculations can be found at #30219. The data are a work-in-progress for now.
TooFuzzy provided us with a handy "Quick AIM Calculator" Here's a link to that page:
A.I.M. Users Bulletin Board (AIMUSERS): Thanks LC, Now they can use the "calculator" again! (advfn.com)
(follow the link on the above page)
AIM has a predictable pattern of "cash burn" in a declining market. Depending upon the SAFE settings AIM will generate new buy orders sequentially as share prices decline. It can be helpful to know in advance about how deeply AIM is going to draw down one's cash reserves. This link is to the "Cash Burn" AIM page. It shows various end points based upon the starting cash reserve level. Here's a link to that page:
"" rel="nofollow noopener noreferrer ugc" target="_blank">http://www.aim-users.com/cashburn.htm"; rel="nofollow noopener noreferrer ugc">A.I.M. Cash Burn Rate (archive.org)
Best wishes,
Old AIM Guy
|
Posts Today
|
0
|
|
Posts (Total)
|
47155
|
|
Posters
|
|
|
Moderator
|
|
|
Assistants
|
| Volume | |
| Day Range: | |
| Bid Price | |
| Ask Price | |
| Last Trade Time: |
