One Month of Positive Seasonality Remaining -- OBV Says, "Maybe Not." By: Carl Swenlin | March 28, 2024
The late Yale Hirsch (Stock Trader's Almanac) has long been known for identifying the six-month periods of positive and negative seasonality in the stock market. The positive period is November through April, and the negative period is May through October. We are currently in a positive period, which has one more month to go. Unfortunately, the OBV (On-Balance Volume) chart is saying that April may not be all that positive.
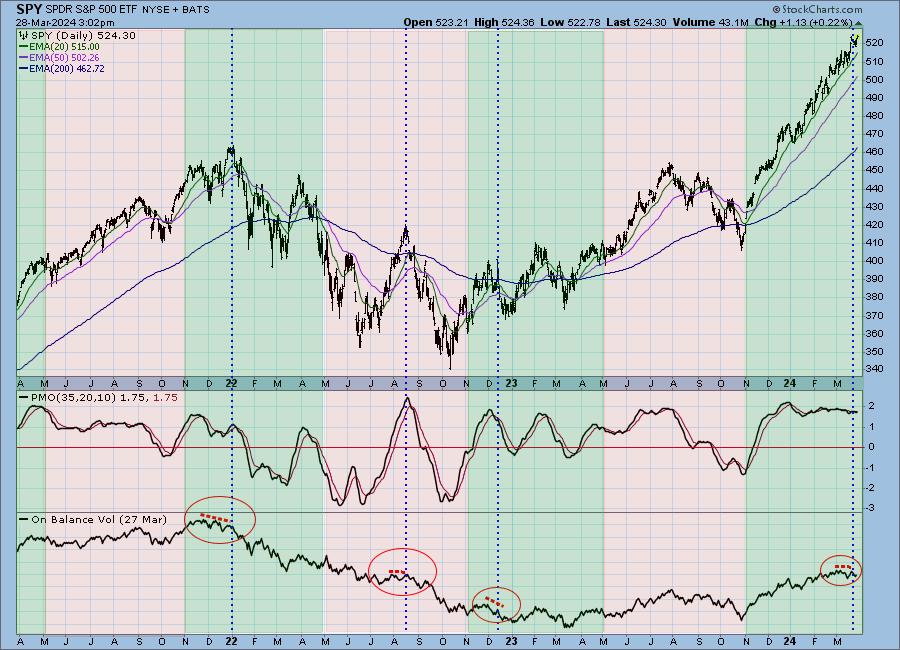
The chart below shows the positive periods (green), and the negative periods (pink), and we can see that the market rarely accommodates that rigid schedule. It loosely fits positive and negative behavior within those brackets, but those periods begin and end pretty much when they feel like it. The current positive period, however, has been exceptionally compliant, beginning at the end of October and continuing with unrelenting positivity through March. Can this possibly continue for another month? Of course it can, but there are signs on the OBV chart that say it may end sooner than that.
OBV (On-Balance Volume) is a cumulative line to (or from) which the day's total volume is added or subtracted based upon whether price closes up or down. Normally, OBV will merely confirm price movement, making lows or highs that match price movement. Boring. What we look for are instances where OBV fails to confirm price. A good example of that on the chart is at the end of 2021, when SPY was making a series of higher tops, but OBV only made a series of lower tops, failing to confirm price movement. Basically, price moved higher, but volume began to thin out. I have marked three other instances where OBV failed to confirm price, and one of them is for the current period.
Conclusion: There are six-month periods of positive and negative seasonality that appear to influence the direction of prices. During the current positive period, beginning in November, the stock market has been unrelentingly positive, but the OBV chart shows that volume has been trending negatively. It could be that the rising trend in prices is about to end.
Information posted to this board is not meant to suggest any specific action, but to point out the technical signs that can help our readers make their own specific decisions. Caveat emptor! • DiscoverGold
Register for free to join our community of investors and share your ideas. You will also get access to streaming quotes, interactive charts, trades, portfolio, live options flow and more tools.


 News
News  Market Data
  Discover