


| Followers | 686 |
| Posts | 142293 |
| Boards Moderated | 35 |
| Alias Born | 03/10/2004 |
Friday, March 01, 2024 4:40:00 PM
By: Erin Swenlin | March 1, 2024
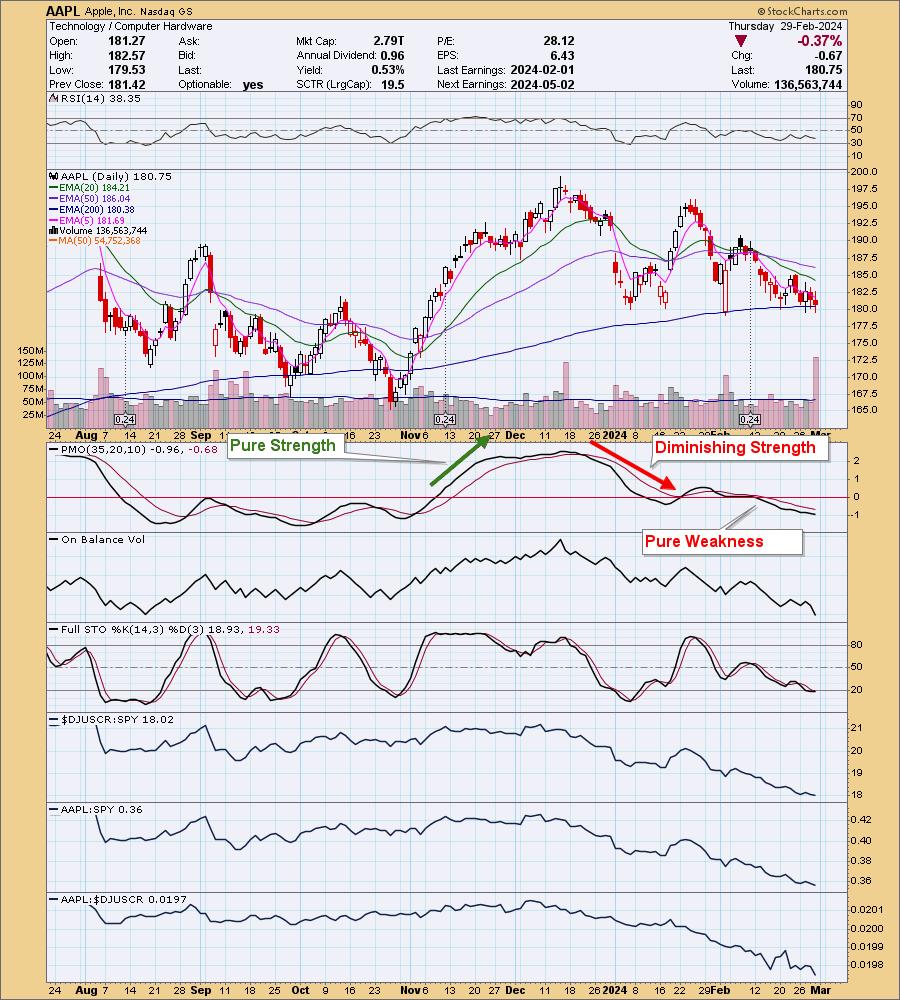
We've begun talking more about the Price Momentum Oscillator (PMO) as it relates to finding "pure strength" and "pure weakness". What it all comes down to is the zero line and the PMO's behavior above or below.
We review the Magnificent 7 charts frequently and we noticed that both Apple (AAPL) and Google (GOOGL) are displaying "pure weakness," as far as the PMO is concerned. Pure weakness is defined by the PMO moving lower or moving sideways below the zero line. The distance the PMO is away from the zero line determines the veracity of the condition.
We can see with AAPL, there was a period of "pure strength" back in November. The PMO had moved above the signal line and was rising strongly. When it topped and began to fall above the zero line, it was a sign of diminishing strength. Pure weakness set in when the PMO dropped beneath the zero line, and it is currently in effect. Had we followed the signal, it would've saved quite a bit of downside.
The rest of the chart looks pretty terrible, as well with a negative RSI and Stochastics below 20. Additionally, relative strength is failing across the board.
We see a similar setup on GOOGL, but this time the signal is arriving NOW as the PMO dropped beneath the zero line. While this doesn't mean a precipitous decline is ahead, it does tell us to tighten up stops, at the very least.
There are signs that there might be further decline ahead for GOOGL. The RSI is negative, and Stochastics are below 20. Additionally, relative strength is failing across the board.
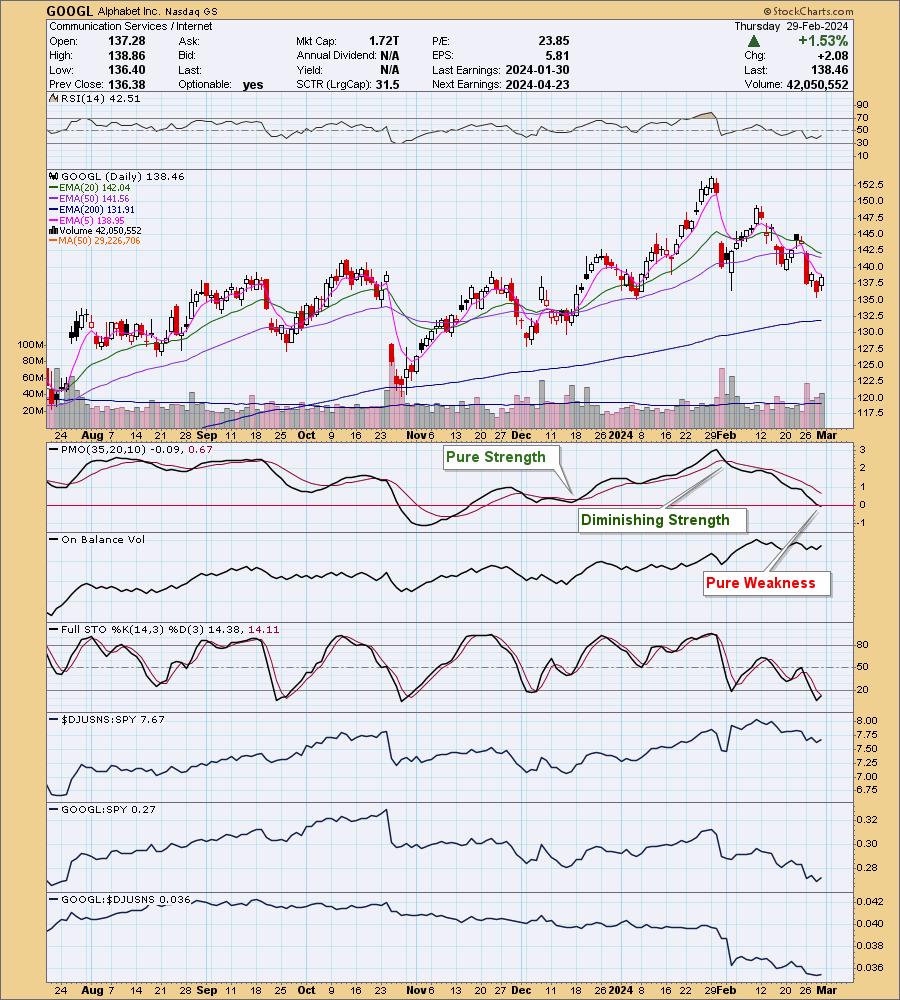
Conclusion: The PMO can be used to determine the strength or weakness in a particular move based on its location and direction around the zero line. Based on the PMO, both Apple and Google are displaying pure weakness.
Read Full Story »»»
 DiscoverGold
Information posted to this board is not meant to suggest any specific action, but to point out the technical signs that can help our readers make their own specific decisions. Caveat emptor!
• DiscoverGold
Recent GOOG News
- MongoDB and Google Cloud Collaborate to Optimize Gemini Code Assist for Developers Building Applications on MongoDB • PR Newswire (US) • 05/02/2024 10:00:00 AM
- Google Terminates Employees Over Protests Against Israeli Government Contract • IH Market News • 04/18/2024 12:20:50 PM
- Apple in Talks with Google to Integrate Gemini AI into iPhone, Shaping a New Era in Tech Collaboration • IH Market News • 03/19/2024 10:39:54 AM
- Futures Pointing To Continued Weakness On Wall Street • IH Market News • 03/05/2024 02:03:27 PM
- U.S. Stocks May Lack Direction Following Yesterday’s Modest Pullback • IH Market News • 02/27/2024 02:14:46 PM
- FTC to Inquire to Microsoft's, Google's, Amazon's AI Partnerships • Dow Jones News • 01/25/2024 06:12:00 PM
- Lüm Mobile Taps Alepo's TelcoBot.ai for Generative AI Customer Service • PR Newswire (US) • 01/25/2024 04:00:00 PM
- Alphabet on Track for Record High Close -- Data Talk • Dow Jones News • 01/25/2024 03:45:00 PM
- Google to Settle Chip Patent Lawsuit With Singular Computing • Dow Jones News • 01/24/2024 07:15:00 PM
- Alphabet Division X Cutting Dozens of Staff, Bloomberg Reports • Dow Jones News • 01/22/2024 04:32:00 PM
- Alphabet on Track for Highest Close Since February 2022 -- Data Talk • Dow Jones News • 01/22/2024 03:36:00 PM
- AST SpaceMobile Gets Investments From AT&T, Google • Dow Jones News • 01/18/2024 10:00:00 PM
- Google to Invest $1 Billion to Build UK Data Center • Dow Jones News • 01/18/2024 06:51:00 PM
- Applied Materials, Google to Collaborate on AR Technology • Dow Jones News • 01/09/2024 01:12:00 PM
- Alphabet on Track for Highest Close Since April 2022 -- Data Talk • Dow Jones News • 12/20/2023 03:49:00 PM
- Trending: Alphabet to Pay $700 Million in Google Play Settlement • Dow Jones News • 12/19/2023 08:13:00 PM
- Trending: Epic Games Wins Antitrust Lawsuit Against Google • Dow Jones News • 12/12/2023 03:50:00 PM
- Alphabet on Pace for Largest Percent Increase Since July -- Data Talk • Dow Jones News • 12/07/2023 03:22:00 PM
- Google, Canada Reach Deal Over Planned Online News Law • Dow Jones News • 11/29/2023 08:05:00 PM
- Google, Canadian Government Reach Deal on Online News Act, CBC Reports • Dow Jones News • 11/29/2023 05:23:00 PM
- VMware and Google Cloud announce planned PostgreSQL-compatible Database Solution for traditional and generative AI applications on VMware Cloud Foundation • Business Wire • 11/07/2023 08:05:00 AM
- Match Group, Google Reach Binding Term Sheet in Legal Battle • Dow Jones News • 10/31/2023 09:29:00 PM
- Alphabet Ends Down 9.5%, Sees Largest Percent Decrease Since March 2020 -- Data Talk Update • Dow Jones News • 10/25/2023 08:59:00 PM
- Alphabet Down Over 8%, on Pace for Largest Percent Decrease in Almost a Year -- Data Talk • Dow Jones News • 10/25/2023 02:48:00 PM
- Stocks to Watch: Microsoft, Alphabet, Stride • Dow Jones News • 10/25/2023 12:16:00 AM
FEATURED POET Wins "Best Optical AI Solution" in 2024 AI Breakthrough Awards Program • Jun 26, 2024 10:09 AM
HealthLynked Promotes Bill Crupi to Chief Operating Officer • HLYK • Jun 26, 2024 8:00 AM
Bantec's Howco Short Term Department of Defense Contract Wins Will Exceed $1,100,000 for the current Quarter • BANT • Jun 25, 2024 10:00 AM
ECGI Holdings Targets $9.7 Billion Equestrian Apparel Market with Allon Brand Launch • ECGI • Jun 25, 2024 8:36 AM
Avant Technologies Addresses Progress on AI Supercomputer-Driven Data Centers • AVAI • Jun 25, 2024 8:00 AM
Green Leaf Innovations, Inc. Expands International Presence with New Partnership in Dubai • GRLF • Jun 24, 2024 8:30 AM

