


| Followers | 689 |
| Posts | 143639 |
| Boards Moderated | 35 |
| Alias Born | 03/10/2004 |
Thursday, June 22, 2023 8:46:43 PM
By: Jayanthi Gopalakrishnan | June 22, 2023
When the stock market trends higher, it doesn't necessarily mean all stocks are moving higher. This is why it's necessary to have a method to filter through the day's market action and select stocks or securities to trade that have the potential for a decent return. And since each trader is different and each trading day is different, it's a good idea to develop various scans that identify securities to trade.
Once you've developed your scans, it's good to get in the habit of running a few of them every day. This can be for several reasons—are your scans still working the way they were designed? Are you getting very few results or too many results? Each day you run the scan, it produces different results, some of which may raise eyebrows. For example, on June 21, one of the stocks that came up in the StockCharts Technical Rank (SCTR) scan was Wynn Resorts Ltd. (WYNN).
During the pandemic, casino stocks suffered, and those with exposure to Macau felt the pain for an even longer period. With China reopening, you'd expect casino stocks like WYNN to recover. But the general thought is that the recovery was priced in, and the stock is due for a pullback.
Earlier this month, Wynn was downgraded by a couple of analysts. So when the stock was one that popped up in the SCTR scan results list, it's worth focusing on the stock and analyzing it more closely.
The Big Picture: Analyzing the Leisure Industry
It may be worth doing a top-down analysis for WYNN stock. Let's start by looking at the hotel, restaurant, and leisure industry by analyzing the S&P 500 Hotels, Restaurants & Leisure Industry index ($GSPHRL). The weekly chart (click on the chart below for live version) shows that the index has been trending higher since October 2022. But it looks like it's reaching a high, which could be a resistance level for the industry. The question is whether the index will break to the upside and reach new highs.
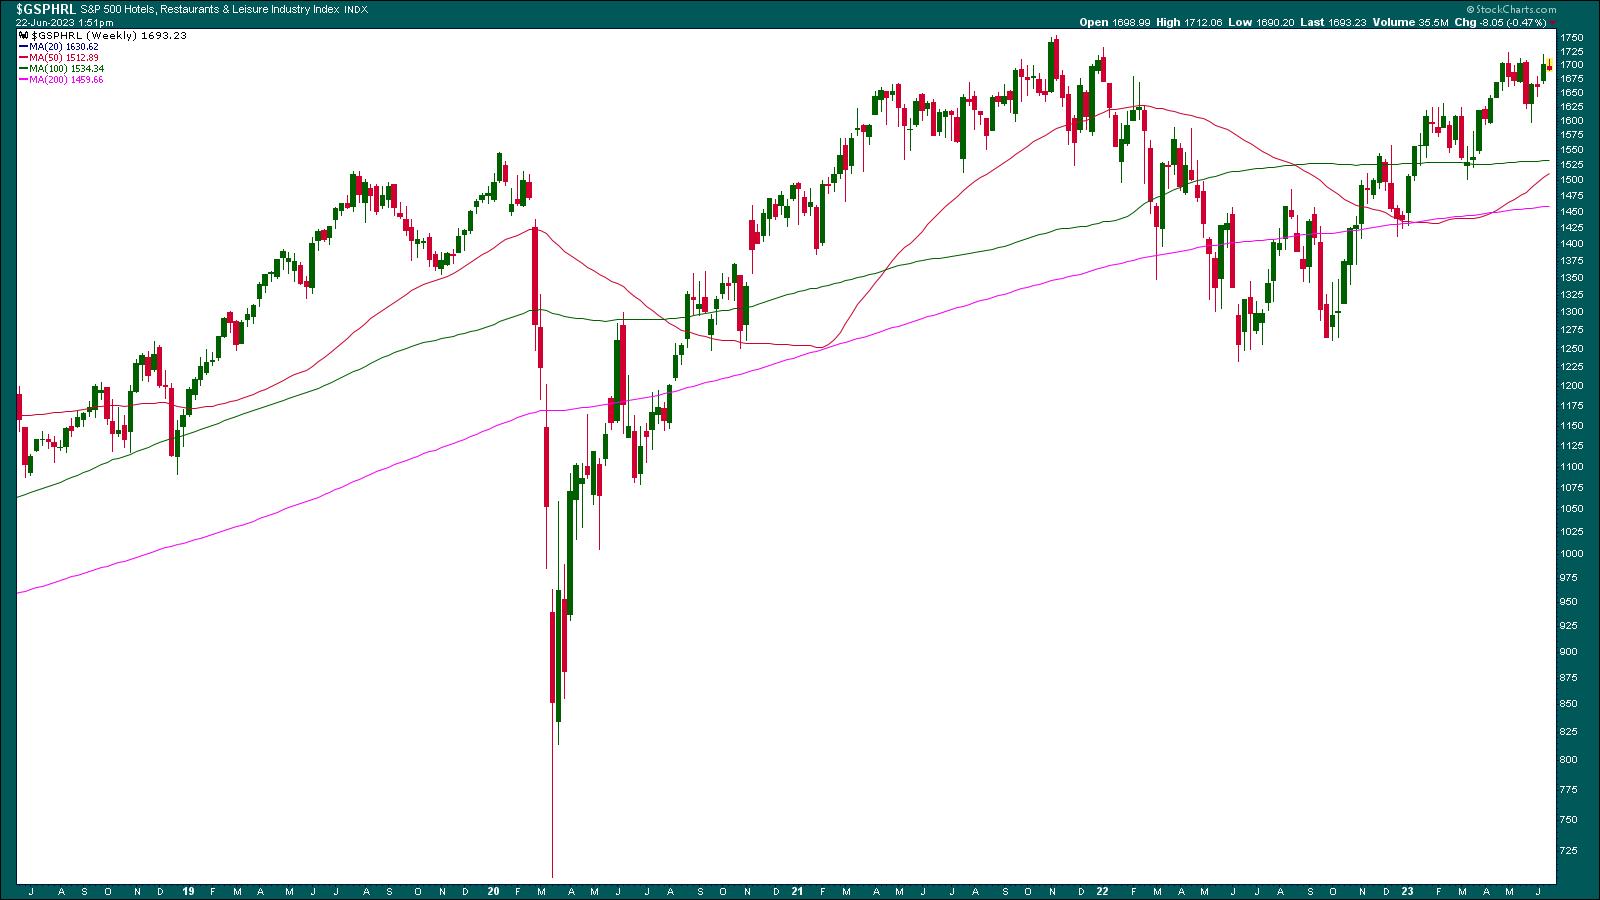
CHART 1: STARTING FROM THE TOP. An analysis of the weekly chart of the S&P 500 Hotels, Restaurants & Leisure industry ($GSPHRL) shows that this group of stocks is trending higher. However, it is pretty close to its high. Will it bust through its highs and move higher?
Chart source: StockCharts.com (click on chart for live version). For educational purposes only.
The index is trading above its 50-, 100-, and 200-week simple moving average (SMA). For as long as people are spending more on discretionary items such as travel and leisure, this index could continue to move higher. But inflation is still a huge concern, and if consumers start cutting back on spending, this index could reverse quickly. So if you are considering investing in WYNN, analyzing $GSPHRL would be your starting point.
A Weekly Perspective of WYNN
Looking at the weekly chart of WYNN, you see that the stock has had its share of ups and downs. Although the stock has been trending higher since October 2022, it's had a tough time breaking above $116.90. Plus, there have been a series of lower highs since 2020.
Adding the 50-week and 100-week SMA to the weekly chart shows that the 50-week is crossing above the 100-week SMA. And that's after the stock has pulled back and bounced off its 200-week SMA. The SMA crossover and WYNN's stock bouncing off its 200-week SMA are positive signs.
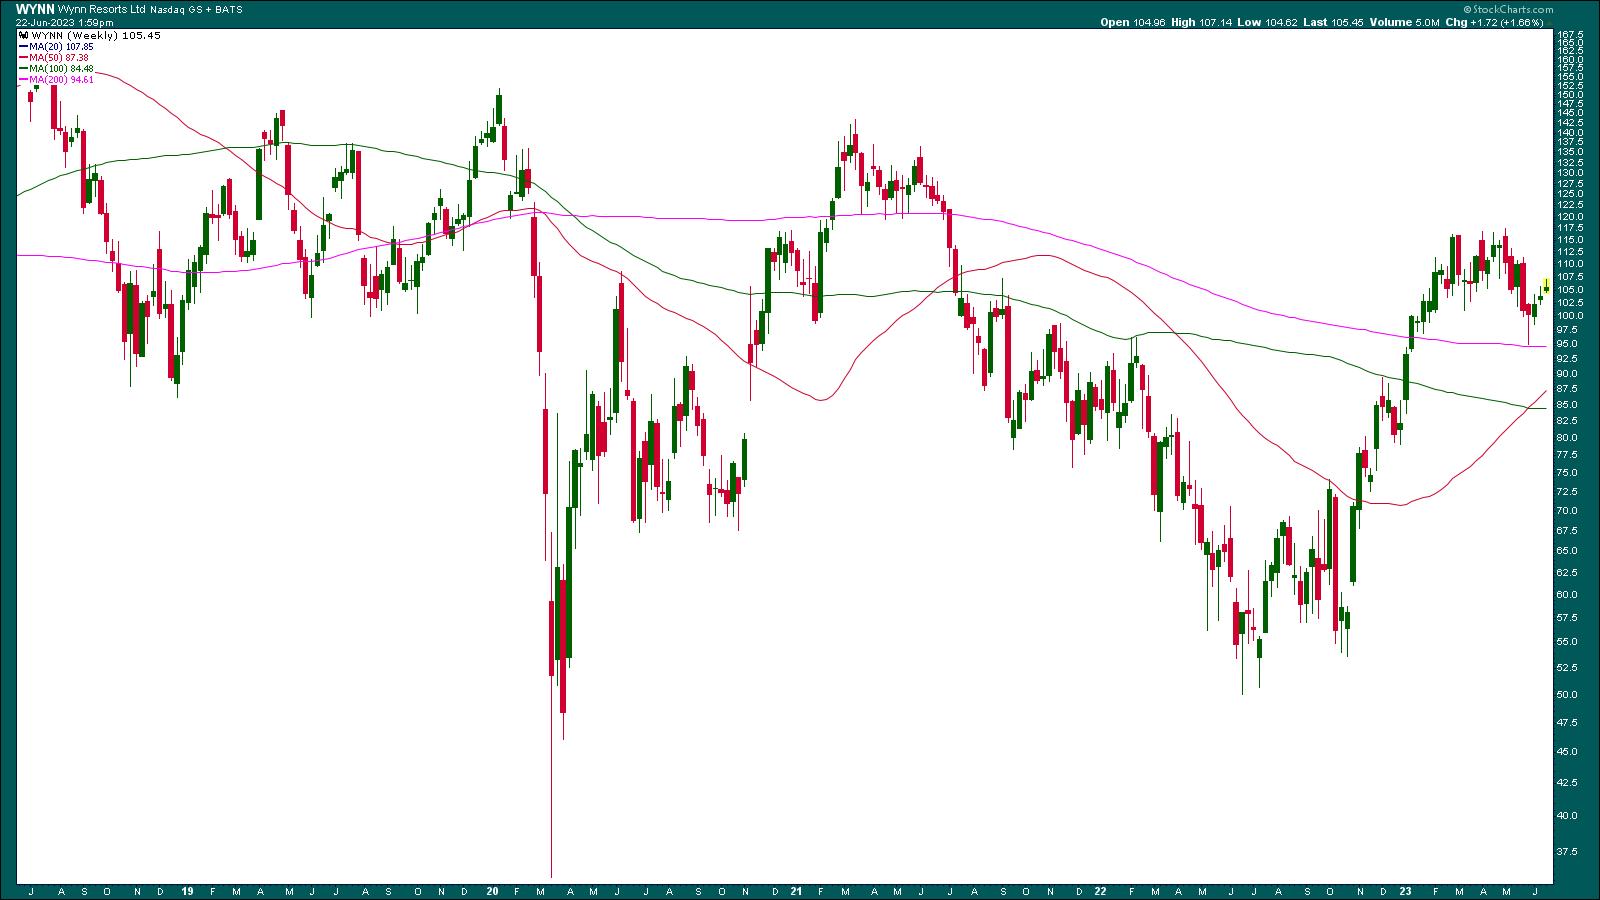
CHART 2: WEEKLY CHART OF WYNN RESORTS. The stock looks to be trending higher but it has to reverse its lower highs pattern to move higher.
Chart source: StockCharts.com (click on chart for live version). For educational purposes only.
If the stock breaks above its $116.90 resistance, it could go as high as $151, the January 2020 high. That's about a $35 move, or almost a 30% move. If that happened, it would reverse the "lower highs" scenario. What are the chances of that happening? To answer that question, let's turn to the daily chart...
* * *
Read Full Story »»»
 DiscoverGold
Information posted to this board is not meant to suggest any specific action, but to point out the technical signs that can help our readers make their own specific decisions. Caveat emptor!
• DiscoverGold
Recent WYNN News
- Form 4 - Statement of changes in beneficial ownership of securities • Edgar (US Regulatory) • 08/14/2024 12:07:59 AM
- Form S-8 - Securities to be offered to employees in employee benefit plans • Edgar (US Regulatory) • 08/12/2024 08:31:01 PM
- Novo Nordisk Adjusts Outlook, Airbnb Drops 16% on Declining U.S. Demand, Lumen Technologies Surges 48% in Premarket • IH Market News • 08/07/2024 09:42:51 AM
- Form 10-Q - Quarterly report [Sections 13 or 15(d)] • Edgar (US Regulatory) • 08/06/2024 08:51:29 PM
- Form 8-K - Current report • Edgar (US Regulatory) • 08/06/2024 08:03:46 PM
- Wynn Resorts, Limited Reports Second Quarter 2024 Results • Business Wire • 08/06/2024 08:02:00 PM
- US Index Futures Rise After Market Sell-off, Oil Prices Trim Losses • IH Market News • 08/06/2024 09:49:06 AM
- Wynn Las Vegas to Host Four Sixes Ranch Steakhouse Pop-up This Fall • PR Newswire (US) • 08/05/2024 05:00:00 PM
- US Index Futures Up Ahead of Fed Decision; Oil Prices Surge Amid Middle East Tensions • IH Market News • 07/31/2024 10:01:30 AM
- Wynn Resorts Announces Second Quarter Earnings Release Date • Business Wire • 07/30/2024 08:05:00 PM
- Form 4 - Statement of changes in beneficial ownership of securities • Edgar (US Regulatory) • 05/29/2024 01:05:02 AM
- Form 144 - Report of proposed sale of securities • Edgar (US Regulatory) • 05/28/2024 03:29:54 PM
- Reddit Rises 15% After First Quarterly Report, Upstart and Twilio Plunge Due to Weak Q2 Forecast, and More in Earnings • IH Market News • 05/08/2024 12:23:27 PM
- Form 10-Q - Quarterly report [Sections 13 or 15(d)] • Edgar (US Regulatory) • 05/07/2024 09:16:45 PM
- Form 8-K - Current report • Edgar (US Regulatory) • 05/07/2024 08:05:38 PM
- Wynn Resorts, Limited Reports First Quarter 2024 Results • Business Wire • 05/07/2024 08:02:00 PM
- U.S. Index Futures Mixed in Pre-Market Tuesday, Oil Dip • IH Market News • 05/07/2024 11:47:40 AM
- Wynn Resorts Releases New, Updated Images of Wynn Al Marjan Island • PR Newswire (US) • 05/06/2024 08:00:00 AM
- Wynn Resorts Releases New, Updated Images of Wynn Al Marjan Island • PR Newswire (US) • 05/06/2024 08:00:00 AM
- Wynn Resorts Announces First Quarter Earnings Release Date • Business Wire • 04/30/2024 08:05:00 PM
- Wynn Resorts Announces Final Results of Tender Offer for Cash by Wynn Las Vegas, LLC for its 5.500% Senior Notes due 2025 • Business Wire • 03/09/2024 01:39:00 AM
- Wynn Las Vegas to Debut Culinary Festival, Revelry, Following The World's 50 Best Restaurants Awards • PR Newswire (US) • 03/06/2024 07:00:00 PM
- Form 4 - Statement of changes in beneficial ownership of securities • Edgar (US Regulatory) • 03/02/2024 12:03:30 AM
- Form 4 - Statement of changes in beneficial ownership of securities • Edgar (US Regulatory) • 03/02/2024 12:02:18 AM
- Form 4 - Statement of changes in beneficial ownership of securities • Edgar (US Regulatory) • 03/02/2024 12:00:33 AM
PickleJar Unveils Latest Venue Managed Services Innovations in Upcoming Webinar • PKLE • Aug 23, 2024 1:11 PM
Element79 Gold Corp Provides Update on Nevada Portfolio • ELMGF • Aug 23, 2024 8:00 AM
Maybacks Adds Award Winning Show to Its Lineup Discusses Maybacks Opportunity • AHRO • Aug 22, 2024 11:30 AM
North Bay Resources Announces First Gold Concentrate at Mt. Vernon Gold Mine, Assays 12 oz/ton Gold, 17.5 oz/ton Platinum, and 8 oz./ton Silver, Sierra County, California • NBRI • Aug 22, 2024 10:28 AM
All Things Mobile Analytic, Inc. Reports Major Growth with Over $11 Million in Revenue • ATMH • Aug 22, 2024 7:19 AM
Unitronix Announces Strategic Entry into Cryptocurrency Space • UTRX • Aug 21, 2024 10:00 AM

