I understand what you are doing but I don't understand the math.
You could just AIM a Dow fund and hold the cash in GLD or IAU ( or even better WPM ) but I don't understand how dividing the dow by gold price gives you the trade signal.
Are you using that ratio as "PRICE" ? Where does your # of shares come from ? What securities are you actually buying ?
AIM was to some extent designed with a sideways trading price range in mind, works better with a price that might range between 0 and 1.0 such as the VIX (volatility index than ranges from 0% to 100%, averages perhaps 50%).
Yes using the Dow/Gold ratio as AIM's "PRICE", with a initial arbitrary portfolio value size (enough to be holding a reasonable number of initial 'shares') and 50/50 initial AIM "stock value" and "cash". 10% of stock value as SAFE, 5% of Portfolio Control minimum trade size (which is slightly better at preserving cash in deep downs than when you use 5% of stock value as minimum trade size, i.e. Newport style AIM rather than online AIM calculator). No adjustment to CASH, as though it were just hard cash (no interest or dividends added, its just a figure that is left as-is, unless increased by a AIM sell trade or reduced by a AIM buy trade).
Run only on paper. Where that AIM indicates a ongoing "%CASH" value. When that AIM trades the actual portfolio (that is traded) is realigned to that %CASH (percentage gold weighting) level with the remainder percentage allocated to a stock index fund (accumulation/total return) such as a Dow Index fund, or even S&P500 index fund, I used total stock market gain figures/values for each year as stored in Simba's backtest spreadsheet https://www.bogleheads.org/wiki/Simba%27s_backtesting_spreadsheet which are in effect similar to S&P500, but in-filled with data prior to when the S&P500 total return data was actually available.
So if the paper AIM indicates a trade, where %CASH is revised to 40%, the actual portfolio would be rebalanced to 60/40 stock/gold weightings. Otherwise if AIM indicates no action you just leave your actual portfolio running as it already is, with dividends assumed to be automatically reinvested into more stock shares (accumulation stock index fund).
I'm observing that calculating the Dow/Gold ratio (DG = Dow price only divided by price of gold), but modified to log scaled of that +1 ... twice, ln(ln(DG +1)+1) better levels the AIM PRICE value (the plus 1's ensures that the log figure doesn't flip negative if the Dow/Gold ratio is less than 1.0). Along with a modification to use increasing PC by 0.425 times the trade value amount after each buy, instead of conventional AIM's increasing PC by 0.5 times the trade value amount after each AIM buy trade signal. That was the natural historic longer term 'trend' that became evident in earlier years, that equally continued into the longer term, in effect has the the longer term log linear regression of the 'share price' and increase in PC levelled to similar rates (historically better centralised the AIM, in a manner that wasn't predictive but that could have been measured/used after observing AIM for 20 or so years).
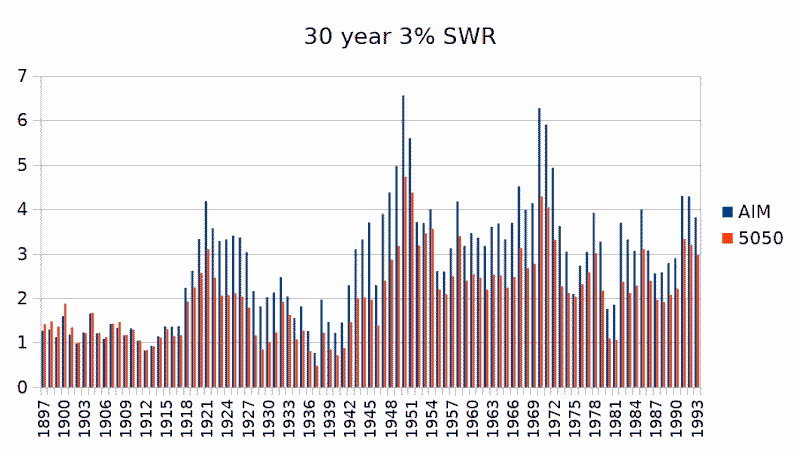
So running AIM from 1897 and leaving it for 20 years or so to settle, and thereafter trading in the above manner resulted in good overall outcomes. For instance over rolling 10 year periods AIM always accumulated a positive real return, whereas 50/50 constant weighted did endure some 10 year periods of negative real returns. Which in turn meant a better (safer) overall outcome over the likes of 30 year periods, a higher/better SWR outcome, including in the worst case 30 year periods.
If you just AIM the regular share price then the tendency is for AIM to be a cash-cow, you end up with too much cash, too little stock. AIM as above instead maintained more equal 50/50 type overall averages but for some 10 year periods might have averaged 60% stock, over other 10 year periods averaged 40% stock in a manner that better reduced risk that in turn led to a better/safer overall outcome.
For example, 3% SWR (3% of initial start date portfolio value drawn as income in the first year where that amount is increased by inflation as the amount of income drawn in subsequent years, for 30 years), and the final portfolio value after 30 years as a multiple of the inflation adjusted start date portfolio value ... for both 50/50 yearly rebalanced, and AIM were ...
Ignoring the first 20 years or so, as time to permit AIM to settle (find its foundations), and subsequently AIM was always better than 50/50 yearly rebalanced, always ended with more residual wealth/value.
Overall the total returns ignoring any withdrawals were similar to 50/50, slightly better, whilst averaging slightly less stock exposure on average, 46% instead of 50%, but where over some 10 year periods AIM averaged 45% stock, in other 10 year periods averaged 61% i.e. adjusted risk exposure up/down in a timely manner that helped to reduce risk. Average 10 year period averaged 56% %CASH (gold) being indicated/aligned to, the same as the overall 100+ year average.
So anyone who started recording a paper AIM as described that aligned their actual stock/gold portfolio as and when that AIM traded, to the level of %stock and %gold that AIM indicated at the time, where they drew a 3% SWR, and for all 30 year start dates since WW1 (1918) onward ... would have ended up better off than compared to another who just rebalanced to 50/50 once yearly. In some cases very little different outcomes, but more often a modestly better outcome, in some cases a significantly better outcome.
Note that what I've described here is different to the settings in the prior thread/post, is a refinement of that, as that prior post was more intended as a indicator of how to run AIM rather than the nitty-gritty of the actual data/values. For the AIM outlined here the values at the end of 2022 were
PC 732 #S 566 CASH 978.40
For those the PRICE used by AIM is that ln(ln(DG+1)+1) measure/value, for instance at the end of 2022 Dow was 33147.25, price of gold was 1812.35, so the AIM 'PRICE' value = LN((LN((33147.25/1812.35)+1))+1) = 1.3761351
which resulted in no-action (continue to HOLD actual portfolio as-is)
Clive
PS. Why 3% SWR in the above, because with a third of total wealth in your home value the average historic imputed rent of 4% = 1.33% proportioned to a third. If the remainder two-thirds liquid assets (stock and gold) provide a 3% SWR = 2% relative to total wealth. Combined imputed + SWR of 3.33%, which after 30 years = return of your inflation adjusted wealth/capital via imputed and SWR, whilst tending to end 30 years with the portfolio wealth (home value + portfolio) still at (or often more than) the inflation adjusted start date wealth. Both have your cake (wealth preserved at the end of 30 years (heirs/longevity)) and having ate it (imputed + SWR return of your money via 30 yearly instalments).
When you start with all of your wealth initially at risk, but have had half of it returned after 15 years via imputed rent and SWR, all of it returned after 30 years, then your average capital at risk over the 30 years = 50%. When you have all of your wealth returned via imputed rent + SWR after 30 years, but also end with that wealth (or more) still available at the end of 30 years, then the real (after inflation) return on average capital at risk is given by
( 2 / 0.5 )^(1/30) - 1 = 4.725% = real return on average capital at risk
Sourced from three assets (land (home), stocks, gold), that for a British investor holding US$/stocks is also three currencies (GB Pounds in home value, US$ in US stocks, gold non fiat commodity currency). And where returns are sourced via imputed rent, stock dividends, SWR. Broad diversification across currencies, assets and geopolitical risk factors, along with diversified sources of 'income'.
A retiree with say $3M total wealth would tend to historically have seen $100K/year 'income', $40K via imputed rent benefit (rent they'd otherwise have had to find/pay if they were renting instead of being a owner-occupier with around $1M valued home value, and assuming a average 4% rental yield), $60K/year disposable income, sourced from stock dividends and SWR withdrawals. Perhaps supplemented with another $30K/year in pension income (that might be considered as being a form of 'bond'). 'Rent' all paid, plus $90K/year disposable income. For a British investor that can be tax efficient, imputed rent isn't taxed, nor do you pay capital gains tax when your primary home is sold. Gold legal tender coins are exempt from taxation. Stocks invested in tax exempt accounts are tax efficient. With some tax harvesting pension and SWR can be tax efficient. Possibly the equivalent of $130K/year total benefit, with little taxes being paid. Comparable perhaps to another that was earning a $200K/year gross wage, that was left with $130K/year after taxation, who rented a home at $40K/year and was left with $90K/year disposable.
Register for free to join our community of investors and share your ideas. You will also get access to streaming quotes, interactive charts, trades, portfolio, live options flow and more tools.