


| Followers | 681 |
| Posts | 141724 |
| Boards Moderated | 35 |
| Alias Born | 03/10/2004 |
Monday, April 17, 2023 8:09:01 AM
By: Jim Curry | April 16, 2023
With the action seen into last week, Gold managed to spike back to higher highs for the swing, with the metal running all the way up to a Thursday peak of 2063.40 (June, 2023 contract) - before selling down sharply into Friday's session.
From the comments made in past articles, we are moving into the range for the next mid-term top for Gold, which does have some potential to have already formed. That peak has been expected to come from the combination of 72 and 310-day cycles that we track, with the smaller 72-day wave shown again on the chart below:
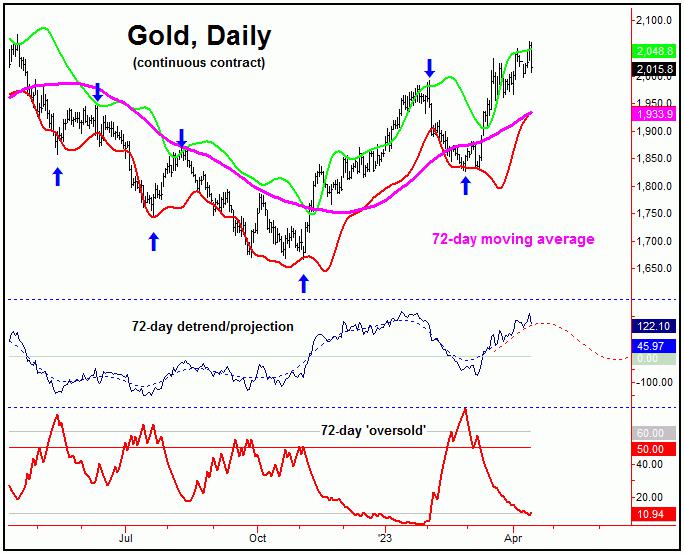
In terms of technical action, of note is that our 72-day 'oversold' indicator (lowest pane, in red) recently dropped back below its lower reference line. Since this indicator moves inverse to price action, a drop back below this lower line is something we expect to see near a price peak for this wave. Having said that, it is too early to say with confidence as to whether this wave has actually topped.
The Good News
In terms of price, a statistical analysis of the smaller 72-day wave has suggested the potential for a spike up to the 2080's or better (June, 2023 contract) before the next mid-term peak was made. With the spike up to the 2063.40 figure into last week, we are still short of this statistical inference.
With the above said and noted, there could still be a final spike back to a higher high before completing the upward phase of this 72-day wave, though this is not guaranteed. In terms of time, our original assessment favored higher highs into the late-April to mid-May timeframe; we will see how this develops.
Right now, it looks as if at least a 'momentum' peak has been seen with the high seen into last Thursday. With that, we are now awaiting confirmation of a bigger turn having occurred - by taking out a key price/reversal figure to the downside - with precise details noted in our Gold Wave Trader report.
The Bad
The bad news for Gold was mentioned in my prior article, which saw our Gold Timing Index forming a divergence against the new price highs, with this indicator shown again on the chart below:
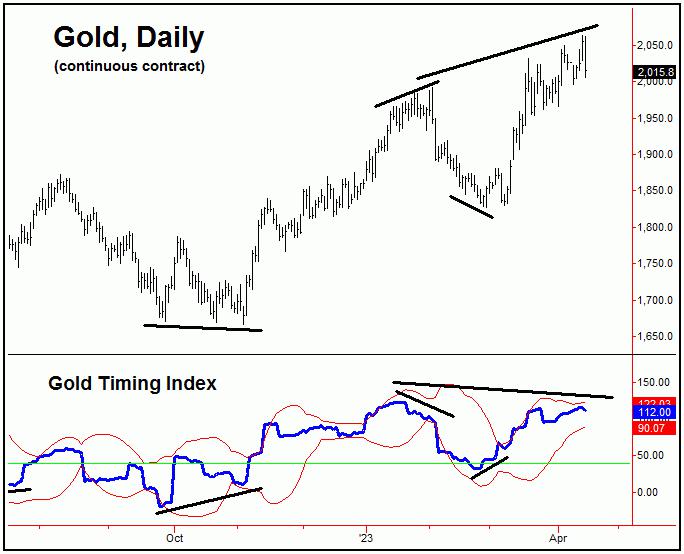
With the action seen into the recent new price high, our Gold Timing Index is still showing a slight divergence against its late-January peak, which is seen as a technical negative - and would be the best argument that a mid-term peak has already been seen for Gold.
Having said the above, the above divergence is small, and could be erased in the days ahead. There is no way to know for certain, other than to assess the action in real-time, as it continues to unfold.
At minimum, however, the above chart would tell you that the upside potential is likely limited for Gold, and the downside risk is much greater going forward.
It Could Get Ugly
As mentioned above, the good news is that Gold could make a try at a higher high (or some secondary high) in the next week or three. The bad news, as mentioned, is that there are technical signs that would support the idea of a mid-term peak already having formed.
The 'ugly' news is this: there is the potential for a decline of as much as 20% off the top in the coming months, due to the configuration of our larger 310-day wave, shown again on the chart below:
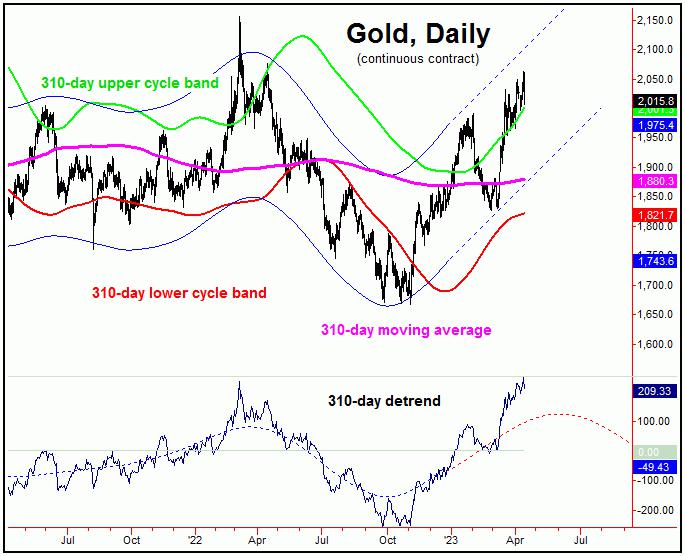
From the comments made in past months, our mid-term view called for strength into the Spring of this year - with that rally favored to be some 20% or more off the November, 2022 trough, the last low for this 310-day wave. That assessment has obviously been met, with Gold rallying some 23% off that November, 2022 bottom.
With the above said and noted, there is the downside risk to a decline of some 20% off the top for Gold, based on a statistical analysis of this wave. For a more recent example, the last peak for this 310-day wave witnessed a decline of 22% from peak-to-trough.
Having said the above, our ideal path is looking for the next downward phase of this 310-day cycle to remain above the November, 2022 low. If correct, a low seen later this year would be expected to give way to a sharp rally in the months to follow - ideally taking the metal back to new all-time highs for the bigger swing well into next year.
Read Full Story »»»
 DiscoverGold
Information posted to this board is not meant to suggest any specific action, but to point out the technical signs that can help our readers make their own specific decisions. Caveat emptor!
• DiscoverGold
Recent GDX News
- YieldMax GDXY Name Change • GlobeNewswire Inc. • 01/25/2024 04:22:00 PM
- Surging S&P 500 Breadth • ValueWalk • 07/19/2023 03:16:37 PM
- S&P 500 Corrects In Breadth • ValueWalk • 07/18/2023 03:08:49 PM
- If The USDX Fell So Much, Why Didn’t Gold Truly Soar? • ValueWalk • 07/17/2023 05:16:20 PM
- USD’s Decline That’s… Bearish For Gold?! • ValueWalk • 07/12/2023 02:38:08 PM
- S&P 500 Late Day Reversal Worry • ValueWalk • 07/10/2023 03:17:34 PM
- Massive Gaming Celebrates Global Launch of House of Blackjack with USDC Earning Race • ValueWalk • 07/10/2023 02:44:17 PM
- Breathers In Mining Stocks Are Not Real Rallies • ValueWalk • 07/06/2023 05:20:55 PM
- S&P 500 Character Changes • ValueWalk • 07/06/2023 03:10:06 PM
- S&P 500 – As Bullish As It Gets • ValueWalk • 07/03/2023 04:01:21 PM
- The Great Gold Migration: How Asia Is Dominating The Global Gold Landscape • ValueWalk • 06/30/2023 05:07:35 PM
- S&P 500 Dip Buying And Tame PCE • ValueWalk • 06/30/2023 03:34:13 PM
- The Bullish Reversal In Gold Is Coming • ValueWalk • 06/29/2023 04:00:44 PM
- Insufficient S&P 500 Rotations • ValueWalk • 06/27/2023 02:41:42 PM
- Failing S&P 500 Rotations • ValueWalk • 06/23/2023 03:09:19 PM
- Countdown to S&P 500 Downleg • ValueWalk • 06/19/2023 01:49:20 PM
- Now THAT Was The Game-Changer For The Price Of Gold! • ValueWalk • 06/15/2023 04:40:35 PM
- S&P 500 Manages To Recover Initial Decline • ValueWalk • 06/15/2023 03:30:07 PM
- S&P 500 Manages To Recover From Tech-Driven Decline • ValueWalk • 06/15/2023 03:30:07 PM
- S&P 500 Withstands The Initial Selling – No Hike Tomorrow • ValueWalk • 06/13/2023 03:15:19 PM
- Roadmap For Mining Stocks – Courtesy Of The Stock Market • ValueWalk • 06/06/2023 03:17:49 PM
- Stocks To Still Extend S&P 500 Upswing • ValueWalk • 06/05/2023 03:31:02 PM
ILUS Provides an Update on the Binding Term Sheet Signed with Actelis Networks (NASDAQ: ASNS) • ILUS • May 31, 2024 12:52 PM
Element79 Gold To Provide Summary and Update on Active Exploration Program, Community Relations at RMEC on June 4 • ELEM • May 30, 2024 1:18 PM
Branded Legacy Secures Exclusive Extraction Partnership with One of the World's Largest Kava Distributors and Producers • BLEG • May 30, 2024 8:30 AM
ECGI Holdings, Inc. Announces $2 Million Debt-to-Equity Conversion • ECGI • May 30, 2024 8:30 AM
North Bay Resources Reports Assays up to >25% Mg, 0.1% Ni, 0.1% Cu, 0.01% Co, 0.3 ppm Pt at Tulameen Platinum Project, British Columbia • NBRI • May 29, 2024 9:03 AM
One World Products, Inc. Issues Shareholder Update • OWPC • May 29, 2024 8:20 AM

