Why Buy DBA: Agricultural Fund ETF? By: Mish Schneider | March 28, 2023
Last week, I tweeted:
I believe the #commodities prices in food softs $DBA have bottomed. $GLD-well those who know me-that I pointed out bottomed months ago. $SLV now outperforming. That tells you something. Maybe even #oil. Get ready for the Commodities Super Cycle.
If you are not following me @marketminute on twitter, you should consider doing so, as I often make such comments or point out specific trades.
Technically, the charts were already setting up for a buy in the individual grains. We decided to focus on DBA.
Fundamentally, we have geopolitical issues, as we know. I also talk about sugar, which still rocketing in price, a lot. Now weather is becoming an additional factor. I read today that Russia is refusing to sell wheat below $275 a ton, which, combined with failing HRW wheat in the plains and Southwest US and heavy snowpack in the northern plains, means supply could get even tighter.
DBA tracks an index of 10 agricultural commodity futures contracts. It selects contracts based on the shape of the futures curve to minimize contango. Specifically, the underlying index includes corn, soybeans, wheat, Kansas City wheat, sugar, cocoa, coffee, cotton, live cattle, feeder cattle, and lean hogs. And there is a K-1 to investors.
Basically, you get great exposure to lots of commodities.
Technical Analysis:
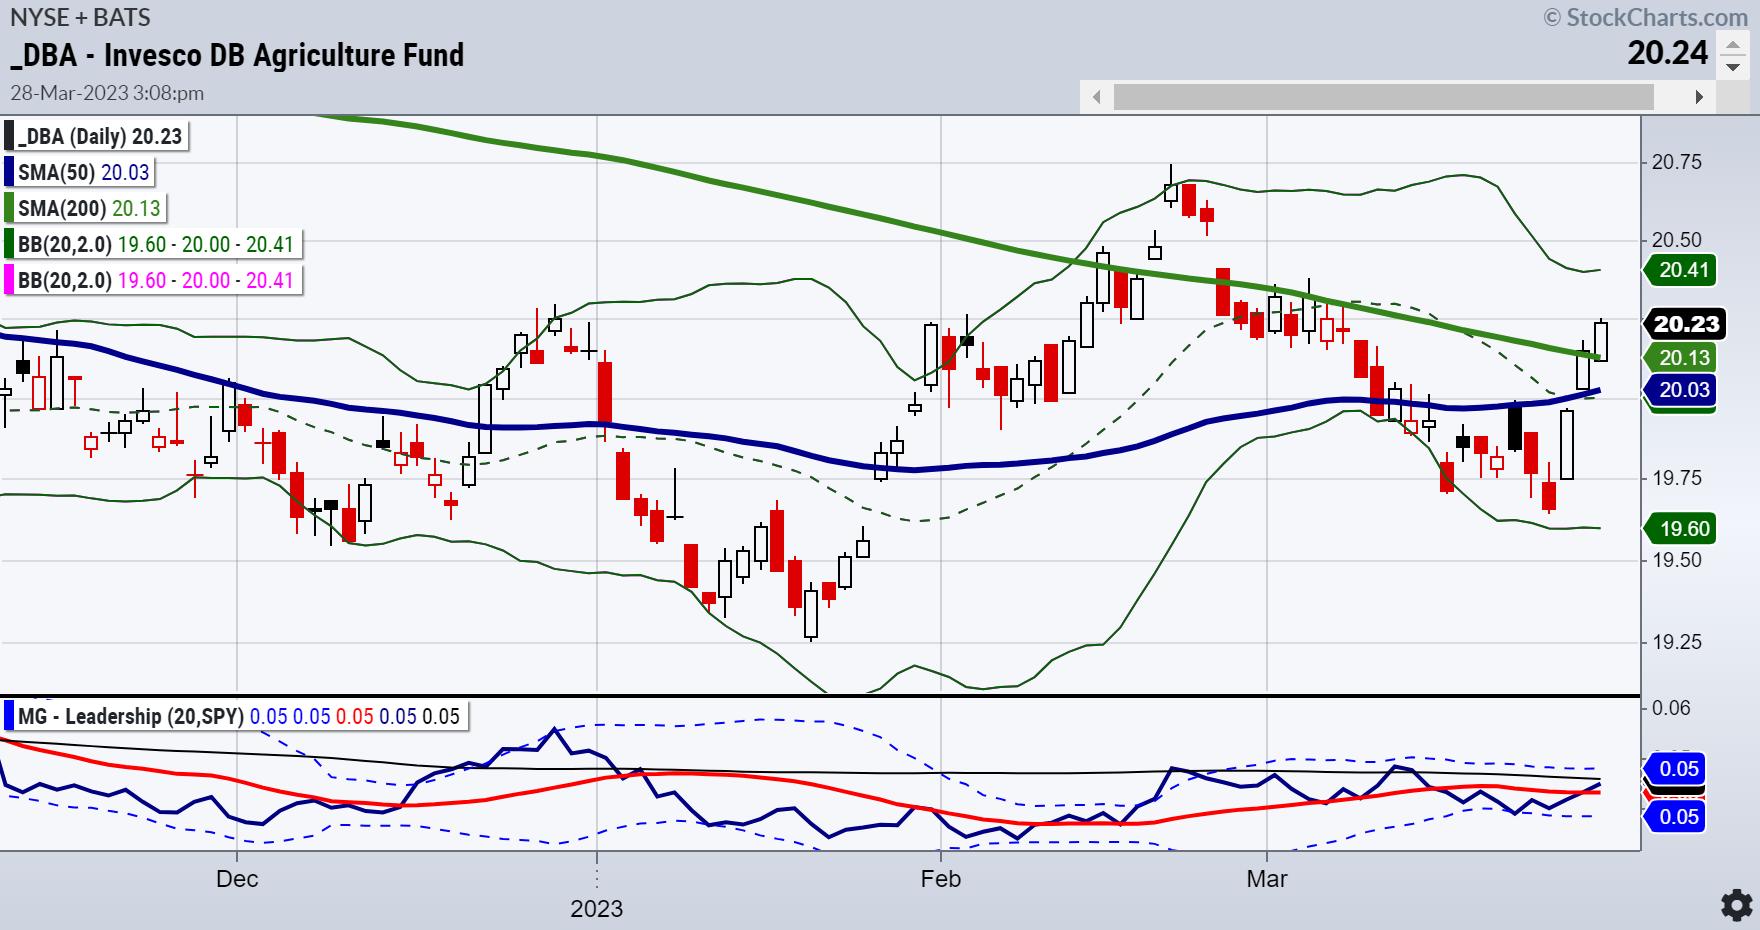
The first chart shows the Triple Play Leadership indicator, or how DBA is performing against the benchmark.
The price chart of DBA shows the 200-DMA above the 50-DMA, or an accumulation phase according to our six market phases. On Tuesday, the price cleared the 200-DMA, closing .40% higher. On the Leadership charts, DBA poke its head out above the benchmark to show it is now outperforming the SPY.
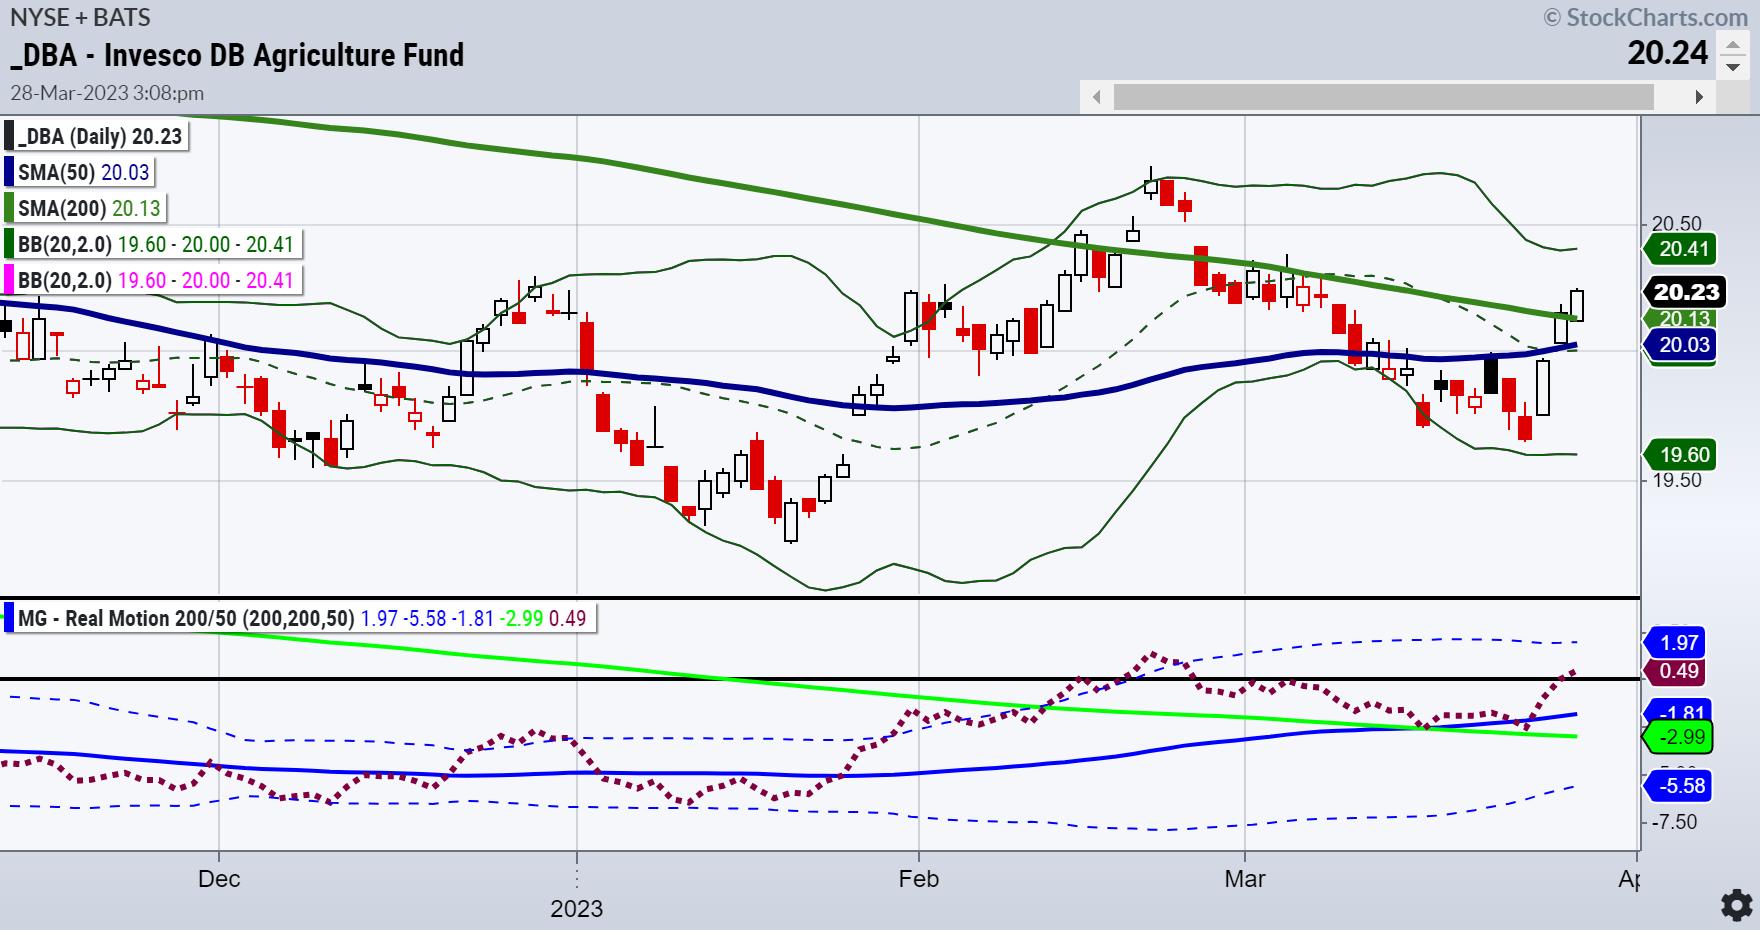
The second chart shows our Real Motion Indicator or momentum. Here's where things get real interesting.
The 50-DMA is ABOVE the 200-DMA. Momentum is in a bullish phase. Furthermore, the red-dotted line, or measure of momentum, cleared both MAs and the black horizontal line or zero point. Bullish momentum and a divergence with the price chart showing the 50-DMA below the 200-DMA.
What does this all mean? Seasonally, we are entering the make-or-break time for crops. Inflation-wise, food prices continue to escalate. In the U.K., grocery inflation rose again in March to a record 17.5%.
Information posted to this board is not meant to suggest any specific action, but to point out the technical signs that can help our readers make their own specific decisions. Caveat emptor! • DiscoverGold
Register for free to join our community of investors and share your ideas. You will also get access to streaming quotes, interactive charts, trades, portfolio, live options flow and more tools.


 News
News  Market Data
  Discover