Wednesday, December 28, 2022 8:25:17 AM
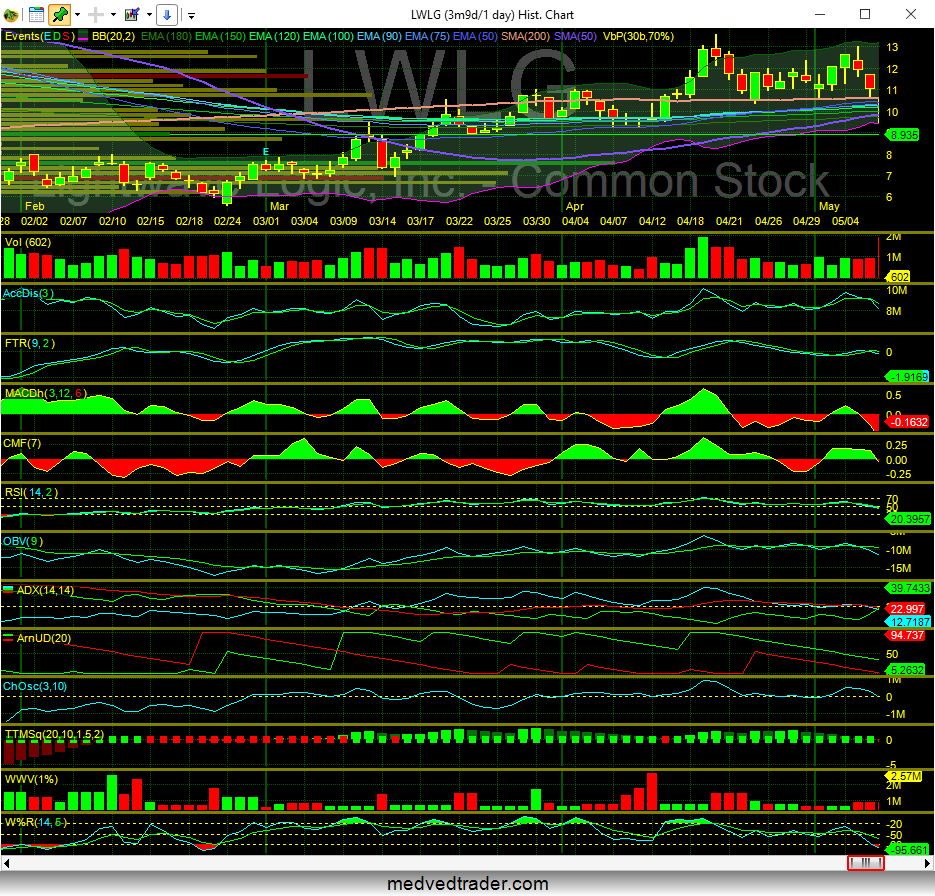
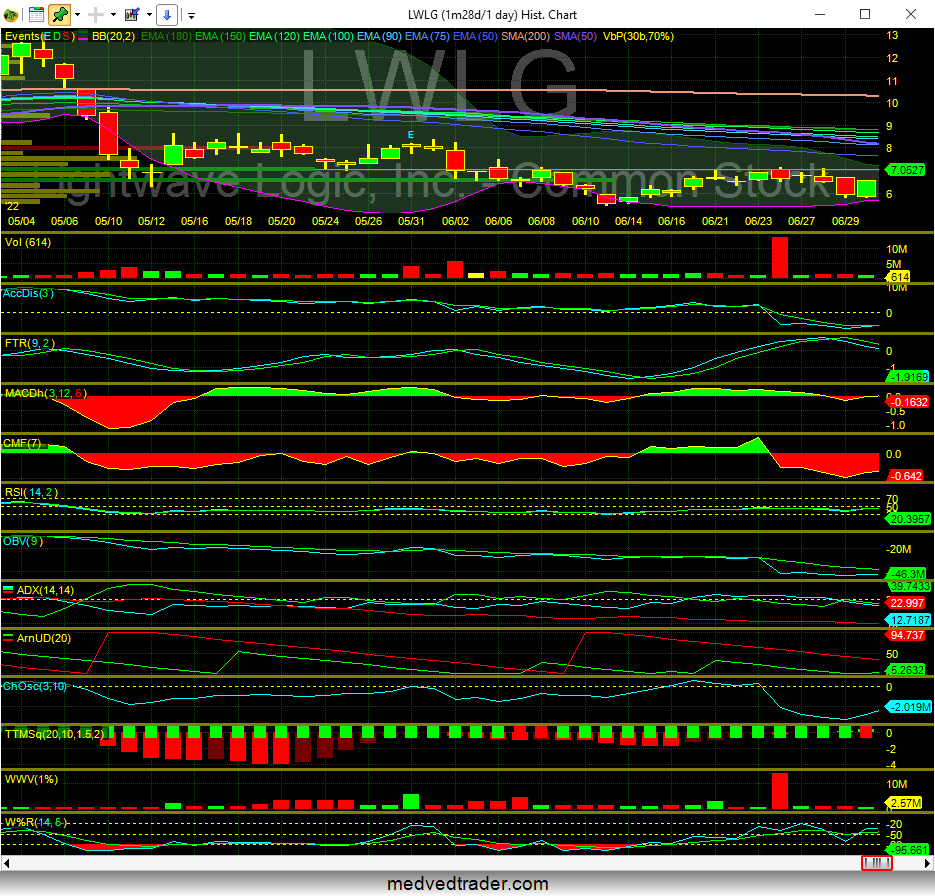
In edit = 5/13 to 6/30 seems to be where most of the damage was done, days to cover have tripled since then.
Order of data:
Settlement Date/Short Interest/Percent Change/ Average Daily Share Volume/Days to Cover

                     01/31/2022	 8,224,272	67.06	1,996,611	4.12
                     01/14/2022	 4,922,847	 9.97	1,113,918	4.42
                     12/31/2021	 4,476,575     102.34	1,842,236	2.43
                     12/15/2021	 2,212,448	28.67	1,649,231	1.34
                     11/30/2021	 1,719,480	(5.48)	  944,571	1.82
                     11/15/2021	 1,819,143	(5.38)	  715,036	2.54
                     10/29/2021	 1,922,613	(9.60) 	  403,339	4.77
                     10/15/2021	 2,126,831	38.81	  477,119	4.40

                    04/29/2022	14,881,642	12.40	1,063,592      13.99
                     04/14/2022	13,239,579	 3.50	  678,095      19.52
                     03/31/2022	12,791,395	10.45	  875,640      14.61
                     03/15/2022	11,580,686	 5.05	  890,355      13.01
                     02/28/2022	11,023,861	 4.63	  872,453      12.64
                     02/15/2022	10,536,146	28.11	  977,195      10.78

                    06/30/2022	20,807,845	6.79	2,426,677	8.57
                     06/15/2022	19,485,684	10.05	1,865,235      10.45
                     05/31/2022	17,706,834	  9.34	1,427,860      12.40
                     05/13/2022	16,194,010	  8.82 	1,715,225       9.40
In edit = 5/13 to 6/30 seems to be where most of the damage was done.
Recent LWLG News
- Lightwave Logic Provides First Quarter 2024 Corporate Update • PR Newswire (US) • 05/13/2024 12:31:00 PM
- Form 10-Q - Quarterly report [Sections 13 or 15(d)] • Edgar (US Regulatory) • 05/10/2024 08:41:09 PM
- Lightwave Logic Demonstrates Thought Leadership with Critical Contributions to Global Integrated Photonics Industry Roadmap • PR Newswire (US) • 04/16/2024 12:31:00 PM
- Lightwave Logic Secures New Patent for Diamondoid Non-linear Optical Chromophore Patent to Improves Material Robustness • PR Newswire (US) • 04/01/2024 12:31:00 PM
- Lightwave Logic EO Polymer Achieves World-Class Performance of 400Gbps with Plasmonic Mach Zehnder Modulator • PR Newswire (US) • 03/28/2024 12:31:00 PM
- Lightwave Logic Demonstrates World-Class 200Gbps Heterogeneous Polymer/Silicon Photonic Modulator Results • PR Newswire (US) • 03/25/2024 12:31:00 PM
- Lightwave Logic to Host Annual Meeting of Shareholders on May 22, 2024 • PR Newswire (US) • 03/19/2024 12:31:00 PM
- Lightwave Logic to Participate in Upcoming Investor Conferences • PR Newswire (US) • 03/15/2024 12:31:00 PM
- Lightwave Logic Provides Fourth Quarter and Fiscal Year 2023 Corporate Update • PR Newswire (US) • 03/01/2024 01:31:00 PM
- Form 10-K - Annual report [Section 13 and 15(d), not S-K Item 405] • Edgar (US Regulatory) • 02/29/2024 10:09:53 PM
- Form 4 - Statement of changes in beneficial ownership of securities • Edgar (US Regulatory) • 12/08/2023 09:00:04 PM
- Form 144 - Report of proposed sale of securities • Edgar (US Regulatory) • 12/07/2023 12:11:28 AM
- Lightwave Logic Issues Shareholder Letter and Provides Corporate Update • PR Newswire (US) • 12/04/2023 01:31:00 PM
- Small Cap Recipient of Military Drone Technology • InvestorsHub NewsWire • 11/20/2023 01:14:45 PM
- Epazz, Inc. (OTC Pink: EPAZ) ZenaDrone Demonstration to Defense Departments of UAE and Saudi Arabia • InvestorsHub NewsWire • 11/15/2023 12:19:31 PM
- Lightwave Logic Provides Third Quarter 2023 Corporate Update • PR Newswire (US) • 11/10/2023 01:31:00 PM
- Form 10-Q - Quarterly report [Sections 13 or 15(d)] • Edgar (US Regulatory) • 11/09/2023 09:24:23 PM
- Lightwave Logic to Participate in Upcoming Investor Conferences • PR Newswire (US) • 11/06/2023 01:31:00 PM
- Lightwave Logic CEO Dr. Michael Lebby to Present at the Optica Photonic-Enabled Cloud Computing Industry Summit • PR Newswire (US) • 10/12/2023 12:50:00 PM
- Lightwave Logic Receives 2023 Industry Innovation Award for Hybrid PIC/Optical Integration Platform at the European Conference on Optical Communications • PR Newswire (US) • 10/03/2023 12:31:00 PM
- Form 8-K - Current report • Edgar (US Regulatory) • 10/02/2023 08:00:08 PM
- Lightwave Logic to Participate in Upcoming Investor Conferences • PR Newswire (US) • 09/05/2023 12:31:00 PM
- Lightwave Logic Expands Its Colorado Operations to Support New Commercial Activities • PR Newswire (US) • 08/21/2023 12:31:00 PM
- Form 3 - Initial statement of beneficial ownership of securities • Edgar (US Regulatory) • 08/10/2023 08:03:22 PM
- Form 8-K/A - Current report: [Amend] • Edgar (US Regulatory) • 08/10/2023 08:01:26 PM
FEATURED Music Licensing, Inc. (OTC: SONG) Subsidiary Pro Music Rights Secures Final Judgment of $114,081.30 USD, Demonstrating Strength of Licensing Agreements • May 17, 2024 11:00 AM
Greenlite Ventures Inks Deal to Acquire No Limit Technology • GRNL • May 17, 2024 3:00 PM
VPR Brands (VPRB) Reports First Quarter 2024 Financial Results • VPRB • May 17, 2024 8:04 AM
ILUS Provides a First Quarter Filing Update • ILUS • May 16, 2024 11:26 AM
Cannabix Technologies and Omega Laboratories Inc. enter Strategic Partnership to Commercialize Marijuana Breathalyzer Technology • BLO • May 16, 2024 8:13 AM
Avant Technologies to Revolutionize Data Center Management with Proprietary AI Software Platform • AVAI • May 16, 2024 8:00 AM


