| Followers | 681 |
| Posts | 141464 |
| Boards Moderated | 35 |
| Alias Born | 03/10/2004 |
Sunday, July 10, 2022 9:19:40 AM
By: Carolyn Boroden | July 8, 2022
• Following the Fibonacci price and timing analysis:
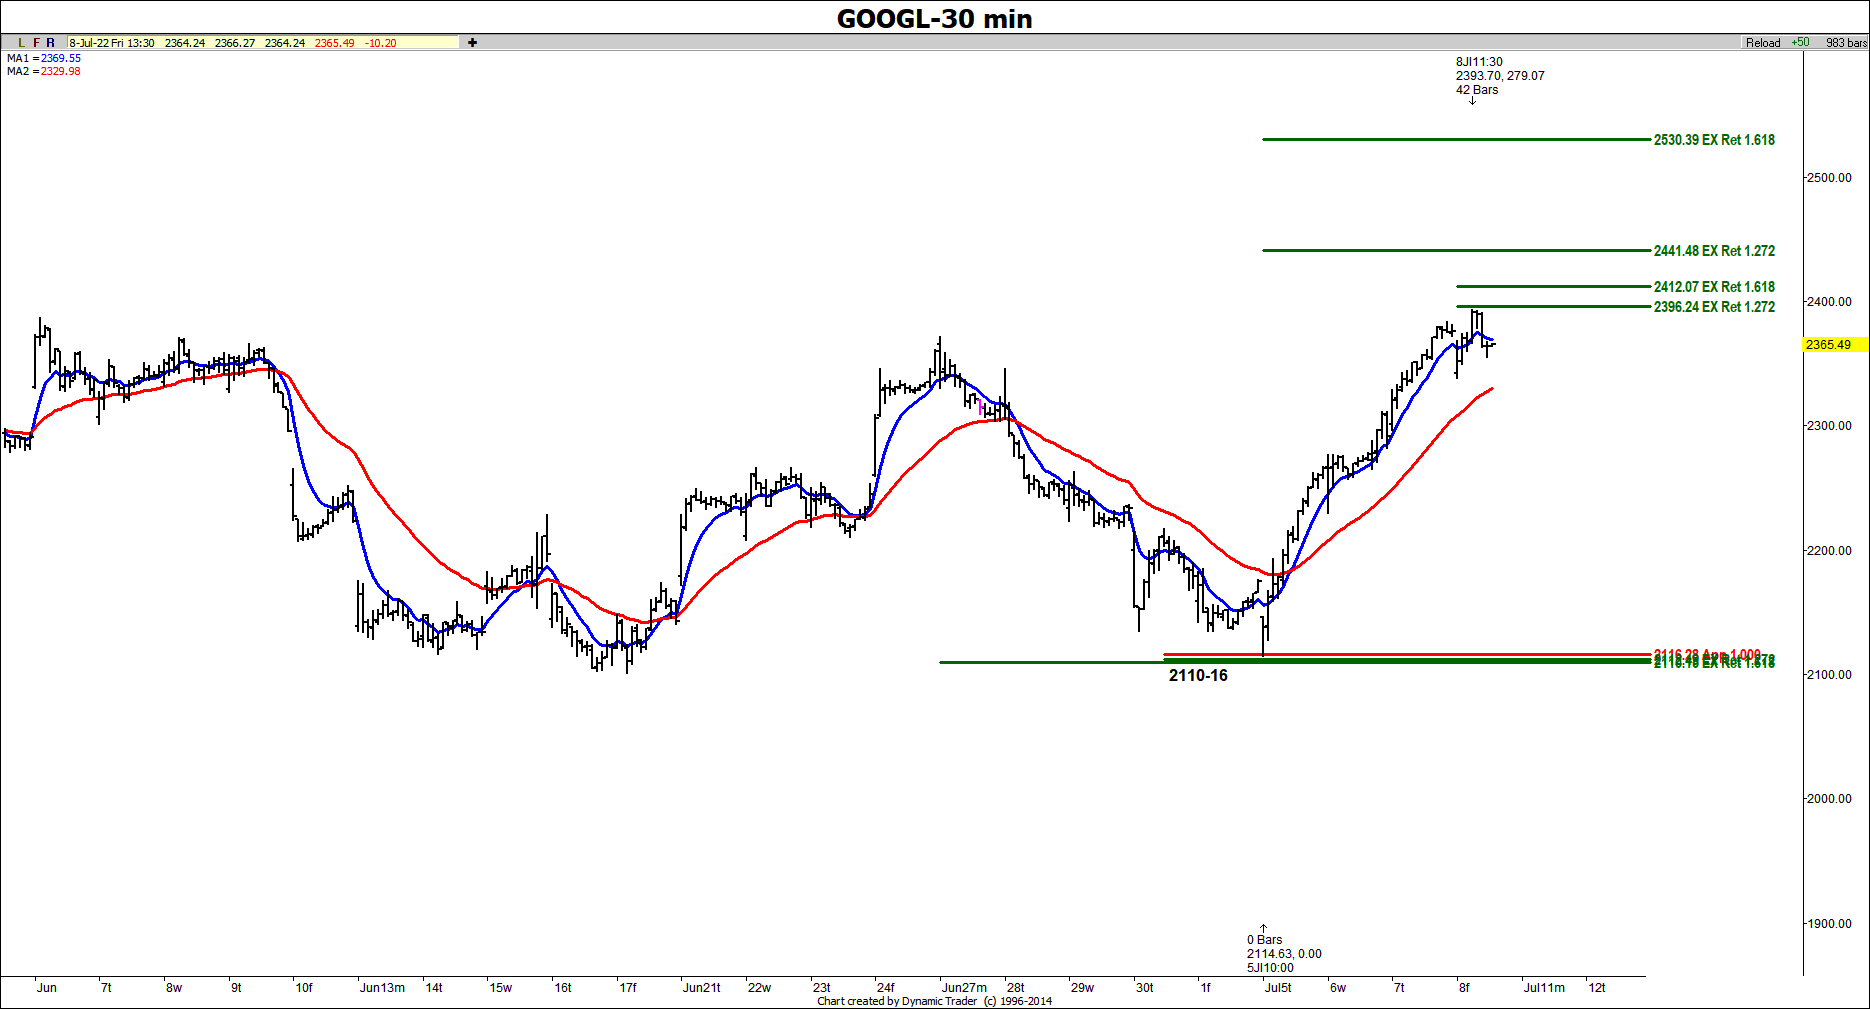
Sometimes when we don't see a setup on a daily chart, the lower time frames fill in the blanks and we find one!
This is an example of a 30-minute chart setup in GOOGL that ended up being tested on 7/5. The zone came in at the 2110-16 area. The actual low was made at 2114.63 which was directly within this price cluster zone. The rally that followed a test of this low has been $279.07 from it.
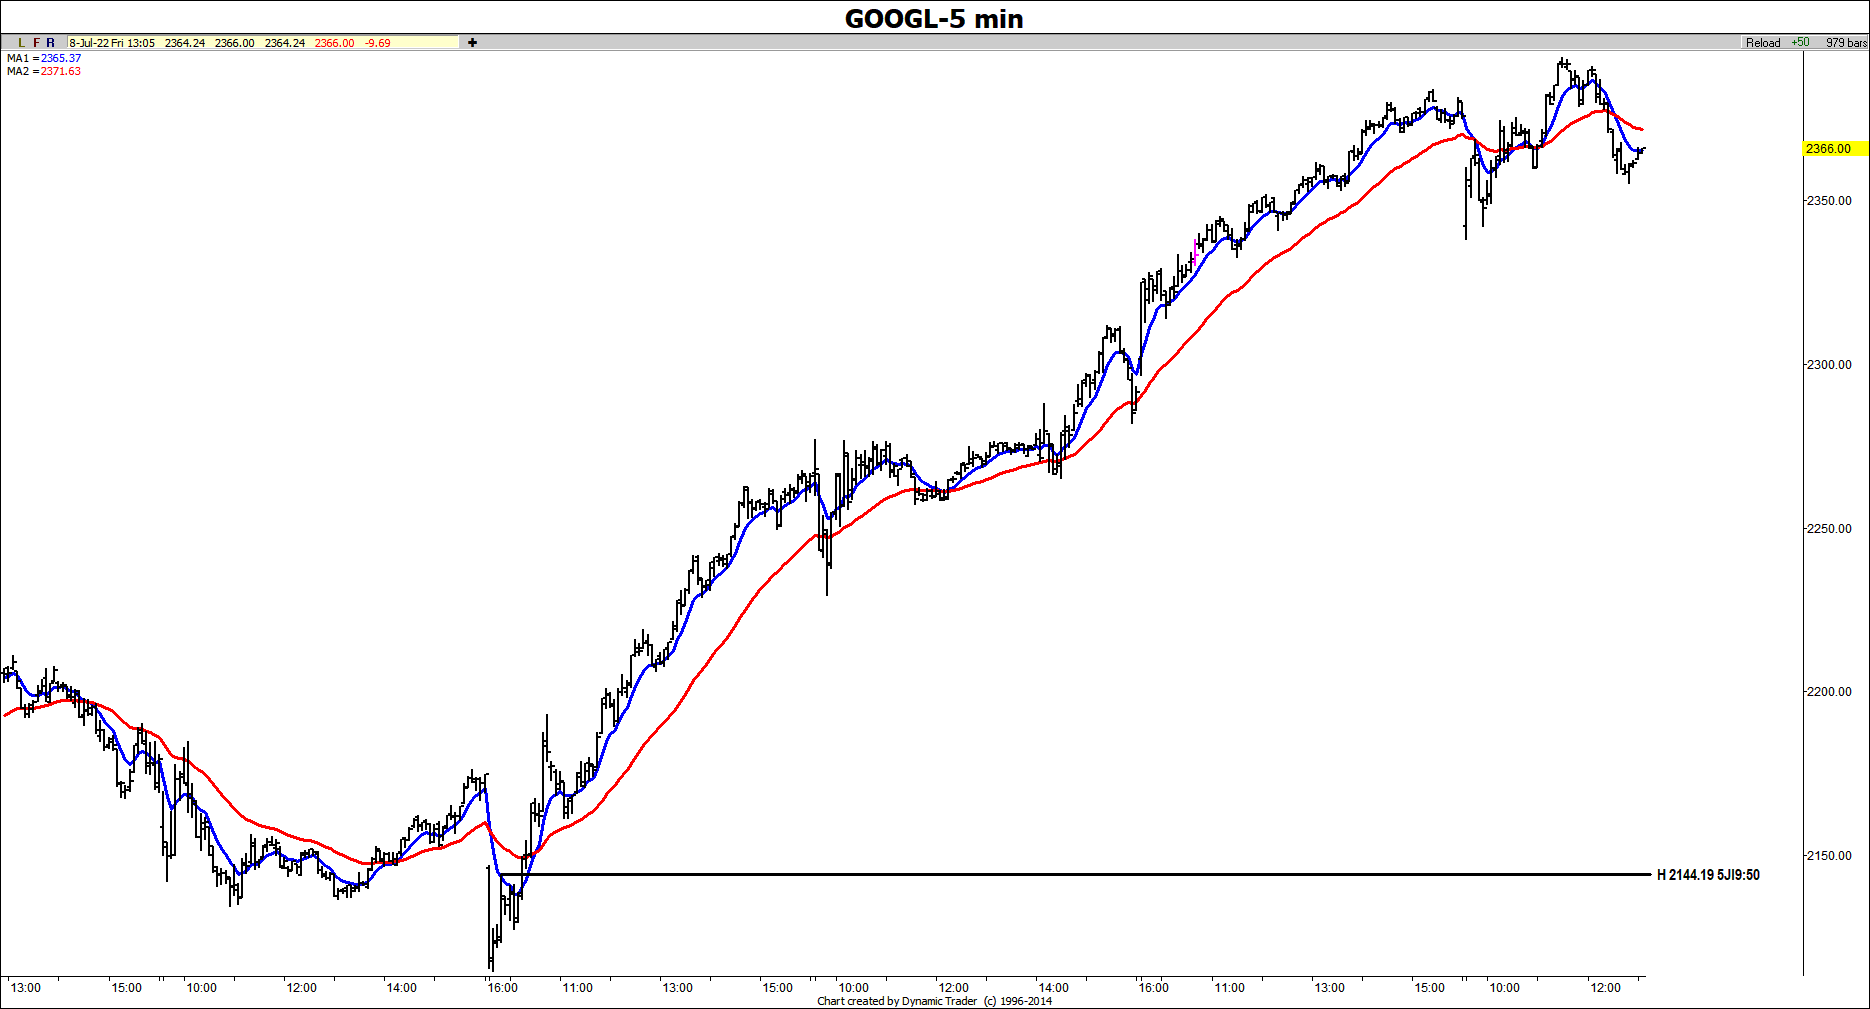
Here is an example of a 5-min chart trigger. Once we saw a prior swing high taken out on the upside along with the 8/34 ema crossover to the upside, you could take the long and risk below the last low or below the actual cluster zone.


Read Full Story »»»
 DiscoverGold
Information posted to this board is not meant to suggest any specific action, but to point out the technical signs that can help our readers make their own specific decisions. Caveat emptor!
• DiscoverGold
Recent GOOG News
- MongoDB and Google Cloud Collaborate to Optimize Gemini Code Assist for Developers Building Applications on MongoDB • PR Newswire (US) • 05/02/2024 10:00:00 AM
- Google Terminates Employees Over Protests Against Israeli Government Contract • IH Market News • 04/18/2024 12:20:50 PM
- Apple in Talks with Google to Integrate Gemini AI into iPhone, Shaping a New Era in Tech Collaboration • IH Market News • 03/19/2024 10:39:54 AM
- Futures Pointing To Continued Weakness On Wall Street • IH Market News • 03/05/2024 02:03:27 PM
- U.S. Stocks May Lack Direction Following Yesterday’s Modest Pullback • IH Market News • 02/27/2024 02:14:46 PM
- FTC to Inquire to Microsoft's, Google's, Amazon's AI Partnerships • Dow Jones News • 01/25/2024 06:12:00 PM
- Lüm Mobile Taps Alepo's TelcoBot.ai for Generative AI Customer Service • PR Newswire (US) • 01/25/2024 04:00:00 PM
- Alphabet on Track for Record High Close -- Data Talk • Dow Jones News • 01/25/2024 03:45:00 PM
- Google to Settle Chip Patent Lawsuit With Singular Computing • Dow Jones News • 01/24/2024 07:15:00 PM
- Alphabet Division X Cutting Dozens of Staff, Bloomberg Reports • Dow Jones News • 01/22/2024 04:32:00 PM
- Alphabet on Track for Highest Close Since February 2022 -- Data Talk • Dow Jones News • 01/22/2024 03:36:00 PM
- AST SpaceMobile Gets Investments From AT&T, Google • Dow Jones News • 01/18/2024 10:00:00 PM
- Google to Invest $1 Billion to Build UK Data Center • Dow Jones News • 01/18/2024 06:51:00 PM
- Applied Materials, Google to Collaborate on AR Technology • Dow Jones News • 01/09/2024 01:12:00 PM
- Alphabet on Track for Highest Close Since April 2022 -- Data Talk • Dow Jones News • 12/20/2023 03:49:00 PM
- Trending: Alphabet to Pay $700 Million in Google Play Settlement • Dow Jones News • 12/19/2023 08:13:00 PM
- Trending: Epic Games Wins Antitrust Lawsuit Against Google • Dow Jones News • 12/12/2023 03:50:00 PM
- Alphabet on Pace for Largest Percent Increase Since July -- Data Talk • Dow Jones News • 12/07/2023 03:22:00 PM
- Google, Canada Reach Deal Over Planned Online News Law • Dow Jones News • 11/29/2023 08:05:00 PM
- Google, Canadian Government Reach Deal on Online News Act, CBC Reports • Dow Jones News • 11/29/2023 05:23:00 PM
- VMware and Google Cloud announce planned PostgreSQL-compatible Database Solution for traditional and generative AI applications on VMware Cloud Foundation • Business Wire • 11/07/2023 08:05:00 AM
- Match Group, Google Reach Binding Term Sheet in Legal Battle • Dow Jones News • 10/31/2023 09:29:00 PM
- Alphabet Ends Down 9.5%, Sees Largest Percent Decrease Since March 2020 -- Data Talk Update • Dow Jones News • 10/25/2023 08:59:00 PM
- Alphabet Down Over 8%, on Pace for Largest Percent Decrease in Almost a Year -- Data Talk • Dow Jones News • 10/25/2023 02:48:00 PM
- Stocks to Watch: Microsoft, Alphabet, Stride • Dow Jones News • 10/25/2023 12:16:00 AM
"Defo's Morning Briefing" Set to Debut for "GreenliteTV" • GRNL • May 21, 2024 2:28 PM
North Bay Resources Announces 50/50 JV at Fran Gold Project, British Columbia; Initiates NI 43-101 Resources Estimate and Bulk Sample • NBRI • May 21, 2024 9:07 AM
Greenlite Ventures Inks Deal to Acquire No Limit Technology • GRNL • May 17, 2024 3:00 PM
Music Licensing, Inc. (OTC: SONG) Subsidiary Pro Music Rights Secures Final Judgment of $114,081.30 USD, Demonstrating Strength of Licensing Agreements • SONGD • May 17, 2024 11:00 AM
VPR Brands (VPRB) Reports First Quarter 2024 Financial Results • VPRB • May 17, 2024 8:04 AM
ILUS Provides a First Quarter Filing Update • ILUS • May 16, 2024 11:26 AM


