


| Followers | 689 |
| Posts | 143817 |
| Boards Moderated | 35 |
| Alias Born | 03/10/2004 |
Sunday, January 09, 2022 12:41:52 PM
By: Jim Curry | January 9, 2022
Recapping Last Week
Last week's action saw gold making higher highs for the swing into Monday's session, here doing so with the tag of the 1833.00 figure (February, 2022 contract). From there, a sharp decline was seen into Friday, with the metal dropping all the way down to a low of 1781.30 - before getting a decent bounce off the same to end the week.
Gold Market, Short-Term
As mentioned in past articles, the upward phase of the 20-day cycle was seen as being in force, which favored additional short-term strength for the metal - and which we did seen into early last week. Here is our 20-day cycle, shown again on the chart below:
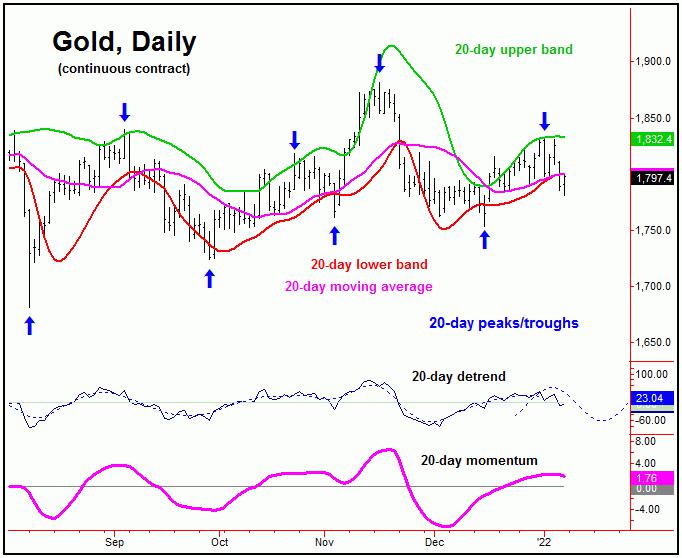
With the action seen last week, the downward phase of this 20-day wave is deemed to be back in force, with the next short-term bottom expected to come from the same.
In terms of time, the most recent upward phase of this wave took 12 trading days before peaking, which is a (bullishly) right-translated wave. With that - along with the fact that the larger 72-day cycle is seen as pointing higher - the probabilities favor a countertrend decline in progress off the 1833.00 swing top.
Going further with the above, we are already into the anticipated bottoming window for this 20-day component. Once its next low is set in place, the ideal path is looking for a push back above the 1833.00 figure in the days/weeks ahead, ideally playing out into the mid-January to mid-February timeframe.
In terms of price, we have a key upside 'reversal point' - a number which, if taken out to the upside in the coming days - will be the trigger for the next short-term rally phase. Exact details are always noted in our Gold Wave Trader market report.
Gold's 4-6 Week Picture
As mentioned in prior articles, the last bottom of significance was expected to come from our larger 72-day cycle component, which is shown again on the next chart:
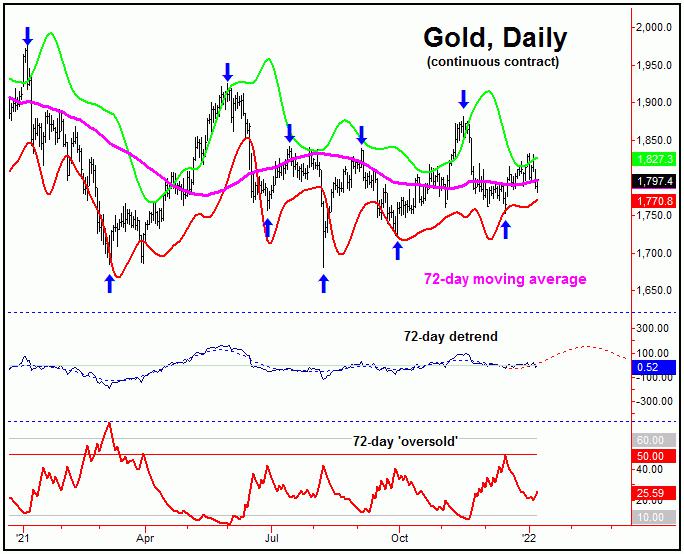
From the comments made in recent months, our 72-day cycle was originally due to bottom out around mid-to-late December, with its actual low coming in on 12/15/21, doing so with the tag of the 1753.00 figure (February, 2022 contract).
In terms of time, the upward phase of our 72-day cycle is expected to hold up into the aforementioned mid-January to mid-February timeframe, but with the latter being more ideal - which is at or into the end of the normal seasonal bullish period for gold.
Going further with the above, if the metal does manage to move back above the 1833.00 swing top in the days/weeks ahead, then we will want to be on the lookout for technical signs of the next peak for our 72-day wave to form.
The number one indication seen at 72-day cycle tops would be for our 72-day 'oversold' indicator to drop back below its lower reference line. Since this indicator moves inversely to price action, a drop below the lower line is something normally seen near tops for this 72-day component.
Until proven otherwise, the probabilities tend to favor the current upward phase of the 72-day cycle to remain below the 1882.10 swing high, seen back in November. If correct, another sharp decline phase is expected to play out into late-Spring, where the next mid-term trough is due, and coming from the combination of 72-day, 154-day and 310-day cycles, with the 310-day wave shown on the chart below:
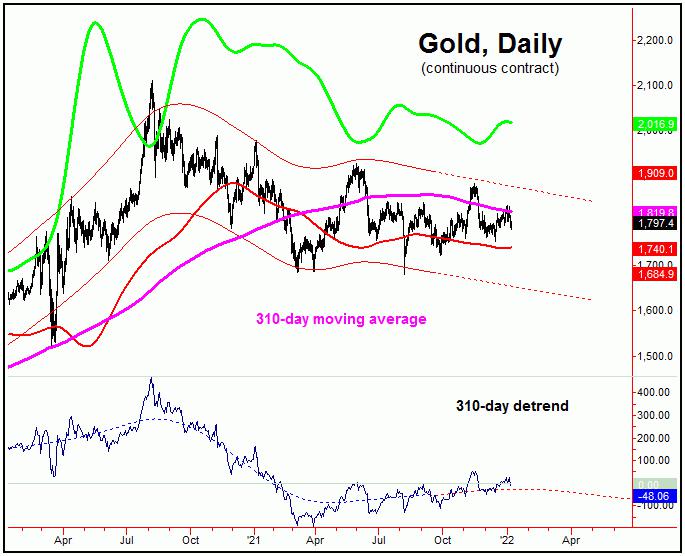
For the bigger picture, from whatever low that ends up forming with the 72, 154 and 310-day cycles into late-Spring of this year, a minimum rally of 15% is likely to play out in the months to follow.
Having said the above, the average rallies with the larger 310-day wave have actually been closer to 25% from trough-to-peak, which should give us some early idea of how the action could play out into later this year, following the next mid-term trough. More on all as we continue to move forward.
Read Full Story »»»
 DiscoverGold
Information posted to this board is not meant to suggest any specific action, but to point out the technical signs that can help our readers make their own specific decisions. Caveat emptor!
• DiscoverGold
Recent GLD News
- Form FWP - Filing under Securities Act Rules 163/433 of free writing prospectuses • Edgar (US Regulatory) • 09/09/2024 10:10:25 AM
- Form FWP - Filing under Securities Act Rules 163/433 of free writing prospectuses • Edgar (US Regulatory) • 08/20/2024 07:21:15 PM
- Form FWP - Filing under Securities Act Rules 163/433 of free writing prospectuses • Edgar (US Regulatory) • 08/20/2024 07:20:31 PM
- Form 10-Q - Quarterly report [Sections 13 or 15(d)] • Edgar (US Regulatory) • 08/06/2024 06:55:39 PM
- Form 8-K - Current report • Edgar (US Regulatory) • 05/29/2024 06:46:50 PM
- Form 10-Q - Quarterly report [Sections 13 or 15(d)] • Edgar (US Regulatory) • 05/08/2024 06:11:30 PM
- Form 10-Q - Quarterly report [Sections 13 or 15(d)] • Edgar (US Regulatory) • 02/08/2024 03:33:22 PM
- Form FWP - Filing under Securities Act Rules 163/433 of free writing prospectuses • Edgar (US Regulatory) • 01/19/2024 05:18:16 PM
- Crypto: RNDR, LINK, CHZ Emerge as Wednesday’s Top Performers, Ethereum Pilots Dencun Update, and More • IH Market News • 01/17/2024 04:51:44 PM
- Form 424I - • Edgar (US Regulatory) • 12/27/2023 04:04:08 PM
- Form FWP - Filing under Securities Act Rules 163/433 of free writing prospectuses • Edgar (US Regulatory) • 12/22/2023 09:02:08 PM
- Form 10-K - Annual report [Section 13 and 15(d), not S-K Item 405] • Edgar (US Regulatory) • 11/22/2023 07:49:08 PM
Lingerie Fighting Championships Signs Broadcast Deal With Maybacks Global Entertainment • BOTY • Sep 26, 2024 9:00 AM
Maybacks Global Entertainment and Lingerie Fighting Championships Enter Into Broadcast And Revenue Sharing Agreement • AHRO • Sep 26, 2024 8:30 AM
North Bay Resources Commences Operations at Bishop Gold Mill, Inyo County, California; Engages Sabean Group Management Consulting • NBRI • Sep 25, 2024 9:15 AM
CEO David B. Dorwart Anticipates a Bright Future at Good Gaming Inc. Through His Most Recent Shareholder Update • GMER • Sep 25, 2024 8:30 AM
Cannabix Technologies and Omega Laboratories Inc. Advance Marijuana Breathalyzer Technology - Dr. Bruce Goldberger to Present at Society of Forensic Toxicologists Conference • BLOZF • Sep 24, 2024 8:50 AM
Integrated Ventures, Inc Announces Strategic Partnership For GLP-1 (Semaglutide) Procurement Through MedWell USA, LLC. • INTV • Sep 24, 2024 8:45 AM

