


| Followers | 689 |
| Posts | 143817 |
| Boards Moderated | 35 |
| Alias Born | 03/10/2004 |
Friday, July 23, 2021 1:13:53 PM
By: Adam Hamilton | July 23, 2021
Gold has been sucking wind this summer, trudging along after getting slammed by a distant-future-rate-hikes scare. The resulting lower prices have really damaged psychology, leaving investors wavering on gold. Their recent capital inflows have reversed into modest selling, contributing to unusual weakness in this leading alternative asset. But investment demand should roar back in this inflationary environment.
Gold entered summer 2021 with strong upside momentum, in a young upleg that had just powered up 13.5% in 2.8 months by early June. This current interrupted upleg is the fifth of gold’s secular bull, and the previous four averaged big 33.3% gains. Gold was progressing nicely until the June 16th meeting of the Fed’s Federal Open Market Committee. The FOMC was expected to do nothing, and that’s what it did.
In a nothingburger monetary-policy decision, the FOMC left its zero-interest-rate policy and $120b per month of quantitative-easing money printing in place indefinitely. There were no hints that either of these hyper-easy policy stances would be changed anytime soon. The leveraged gold-futures speculators who dominate gold’s short-term fortunes should’ve yawned at that, and gone back to enjoying lazy summers.
But with every other FOMC decision, the Fed releases a Summary of Economic Projections that shows where individual top Fed officials expect to see certain economic data in coming years. That includes their outlooks for the federal-funds rate, which are gathered in a scatter chart known as the “dot plot”. In mid-June’s version, 6 out of 18 top Fed officials thought there might be two quarter-point hikes into year-end 2023!
That was about 2.5 years into the future, an eternity away in the markets. And the dot plot has proven a notoriously-inaccurate FFR predictor anyway. That very afternoon the Fed chair himself warned that the dots are “not a Committee forecast, they’re not a plan. ... the dots are not a great forecaster of future rate moves.” He said they should “be taken with a big grain of salt.” Jerome Powell advised to ignore the dot plot!
That is wise given dots’ dismal track record, as they’ve often proven dead-wrong. Back in December 2015 after the first rate hike of the last cycle, top Fed officials expected four more rate hikes in 2016. But only a single one happened, a year later in December! In December 2018 with the ninth hike of that cycle, the dots predicted three more hikes in 2019 and 2020. Zero of those actually came to pass, that hiking was done.
Yet in mid-June 2021, futures traders active in US-dollar and gold contracts acted as if those distant-future hawkish dots were an official FOMC decree heralding a new hiking cycle. So they bid up the US dollar sharply on prospects for higher rates, which unleashed withering gold-futures selling. In three trading days starting with the FOMC, the US Dollar Index blasted 1.9% higher hammering gold a brutal 5.2% lower!
I wrote about that Fed-gold-futures purge extensively that very week, analyzing how specs’ positioning leading into it meant their selling firepower would quickly exhaust itself. That indeed proved true, as gold bottomed after that kneejerk several-day pummeling. But that anomalous plunge left serious sentiment damage in its wake. Bearishness flared overpowering bullishness, leaving traders discouraged on gold.
This indexed gold-summer-seasonals chart is updated from my latest essay on that research thread of a few weeks ago. It renders all modern-gold-bull-year summers in like terms by indexing gold’s price action to May’s final close. Note that mid-June’s ridiculous gold plunge on unofficial rate-hike projections way out into the distant future made for one of gold’s weakest summers ever. That has left investors wavering.
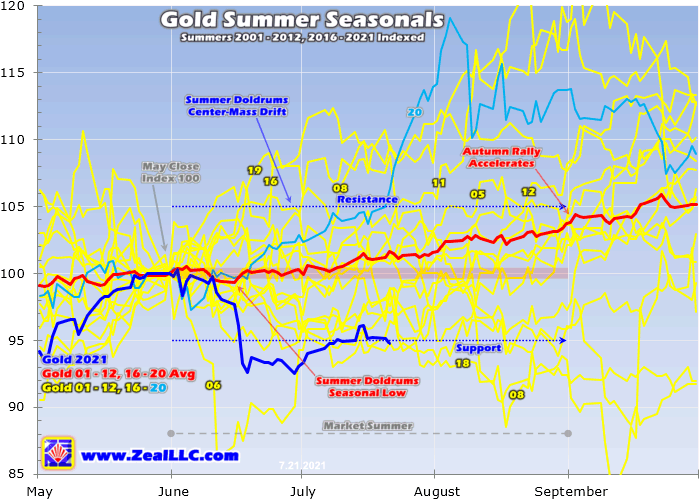
Out of 18 gold-bull years between 2001 to 2012 and 2016 to 2021, gold has only suffered a worse June once. That was way back in 2006, in a radically-different situation that justified a sharp correction. Gold had just rocketed 46.2% higher in only 4.6 months into mid-May, leaving it incredibly overbought! So a big-and-fast correction was necessary to rebalance sentiment. That sure wasn’t the case this summer.
Gold has recovered some since that hawkish-Fed-dots pummeling, but remains way down summer-to-date. By mid-July, gold had rallied 3.8% regaining about two-thirds of its post-FOMC losses. But gold had also fallen considerably in the few days leading into that FOMC meeting, as traders worried the Fed might warn it was starting to think about tapering its QE bond monetizations. That didn’t happen though.
Gold entered June at young-upleg highs near $1,903, retreated to $1,859 on the eve of that FOMC day, plummeted to $1,763 a few trading days later, then rebounded to $1,829 a couple weeks ago. That wild mostly-downside ride has left investors wary of the yellow metal. They like to chase upside momentum, which has been sorely lacking in gold this summer. Thus investment capital flows have reversed to selling.
Comprehensive global gold supply-and-demand data is only published once a quarter by the World Gold Council, in their fantastic Gold Demand Trends reports. But a great high-resolution daily proxy for world gold investment is the physical-gold-bullion holdings of the leading and dominant gold exchange-traded funds. These are of course the massive American GLD SPDR Gold Shares and IAU iShares Gold Trust.
In the WGC’s latest GDT covering Q1’21, GLD and IAU commanded 29.0% and 14.1% of all the gold held by all the world’s physically-backed gold ETFs! The distant third was a UK competitor at just 6.3%. Global gold ETFs suffered major draws in Q1 as investors fled a gold correction. GLD+IAU holdings alone accounted for nearly 7/8ths of that world total. These huge ETFs increasingly dominate gold investment.
This next chart superimposes GLD+IAU holdings over gold itself, revealing how they moved during major uplegs and corrections in the yellow metal. For our purposes today, we are zooming in to the action this summer. Investment capital was flowing into gold before that hawkish-Fed-dots scare, stalled in its wake, then rolled over into modest selling since gold’s recovery has been anemic. That has weighed on prices.
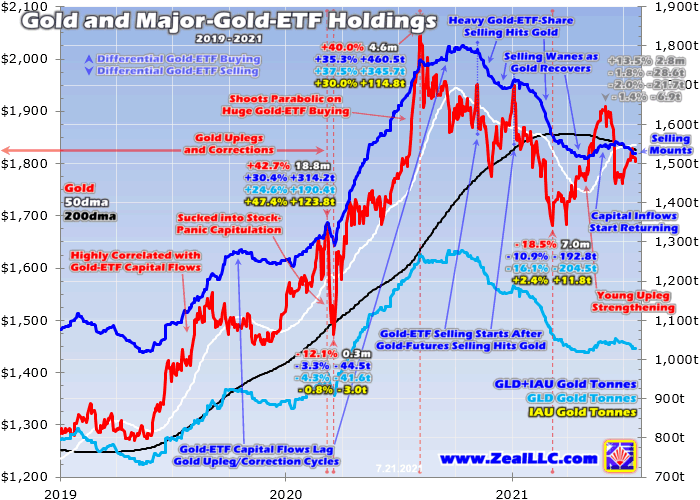
Gold’s anomalous post-FOMC plunge is readily apparent even at this multi-year scale, and the trajectory of GLD+IAU holdings and thus investment capital flows have turned south since. Heading into June, the combined GLD+IAU holdings were running 1,543.8 metric tons. Despite gold’s slump ahead of that FOMC meeting on unfounded QE-tapering fears, GLD+IAU holdings edged up 0.2% to 1,547.6t on that Fed eve.
Then initially as gold plummeted 5.2% in those three trading days starting with those hawkish dots, that didn’t seem to faze investors. The capital inflows into gold via differential gold-ETF-share buying not only persisted, but accelerated. GLD+IAU holdings climbed 0.6% to 1,556.8t during that gold-plunging span! But after gold failed to recover fast in a sharp V-bounce, investors’ confidence in its near-term outlook waned.
Gold investment-capital outflows were small in the last couple weeks of June, with GLD+IAU holdings slipping 0.4% by month-end from their post-FOMC high. But unfortunately that differential gold-ETF-share selling has intensified since. By mid-July, GLD+IAU holdings had fallen another 1.6% month-to-date to 1,525.2t. Overall between soon after the FOMC to last Friday, those draws totaled 2.0% or 31.5t.
Fortunately this mounting selling remains modest if not smallish. For some perspective, in just the single Commitments-of-Traders week straddling that mid-June FOMC meeting speculators dumped the gold-futures equivalent of 89.7t! That is what blasted gold 5.2% lower in three trading days despite that concurrent build in GLD+IAU holdings. So this mid-summer gold investment selling hasn’t been a threat yet.
And it shouldn’t become one, as gold has been holding its own since that ridiculous distant-future-rate-hikes scare and clawing its way back higher on balance. But this festering investment selling is certainly reinforcing gold’s slow recovery. Again investors live to chase upside momentum, and gold has mostly been lacking in that department because of those hawkish Fed dots. So investors have been wavering since...
* * *
Read Full Story »»»
 DiscoverGold
Information posted to this board is not meant to suggest any specific action, but to point out the technical signs that can help our readers make their own specific decisions. Caveat emptor!
• DiscoverGold
Recent GOLD News
- Porgera Mine Working with UN and Enga Provincial Government to Provide Humanitarian Aid to Violence-Stricken Province • GlobeNewswire Inc. • 09/20/2024 03:35:21 PM
- Barrick Continues to Unlock Value Embedded in Its Asset Base • GlobeNewswire Inc. • 09/17/2024 05:00:29 PM
- Feasibility Study on Lumwana Super Pit Expansion Expected by Year-End • GlobeNewswire Inc. • 09/11/2024 09:00:00 PM
- Key Projects Advance as Barrick Keeps Tight Focus on Value Creation and Growth • GlobeNewswire Inc. • 08/12/2024 10:00:00 AM
- Barrick Declares Q2 Dividend and Buys Back Shares • GlobeNewswire Inc. • 08/12/2024 09:59:00 AM
- U.S. Futures Steady as Markets Await Key Inflation Data, Oil Prices Climb • IH Market News • 08/12/2024 09:47:41 AM
- Mining Plays a Vital Role in Advancing the UN’s Sustainable Development Goals, says Barrick • GlobeNewswire Inc. • 08/02/2024 06:45:39 PM
- Porgera Remains On Track Despite Mulitaka Landslide Challenges • GlobeNewswire Inc. • 07/25/2024 11:00:00 AM
- Higher Q2 Production Puts Barrick On Track to Deliver 2024 Targets • GlobeNewswire Inc. • 07/16/2024 11:00:00 AM
- Barrick Continues to Invest in Mali • GlobeNewswire Inc. • 07/09/2024 07:00:00 PM
- Exploration Success, Capital Investment and Reserve Growth to Sustain Kibali’s Production Profile • GlobeNewswire Inc. • 07/02/2024 04:00:00 PM
- Barrick and Zijin Contribute $1 Million to Support Papua New Guinea Landslide Victims • GlobeNewswire Inc. • 06/07/2024 11:18:39 AM
- Form SD - Specialized disclosure report • Edgar (US Regulatory) • 05/29/2024 08:01:04 PM
- Barrick’s Sustainability Strategy Delivers Real Value to Stakeholders • GlobeNewswire Inc. • 05/15/2024 11:00:00 AM
- Barrick Announces Extensive Exploration Partnership with Geophysx Jamaica • GlobeNewswire Inc. • 05/01/2024 10:15:00 AM
- Barrick to Ramp Up Production As It Remains On Track to Achieve 2024 Targets • GlobeNewswire Inc. • 05/01/2024 10:00:00 AM
- Barrick Declares Q1 Dividend • GlobeNewswire Inc. • 05/01/2024 09:59:00 AM
- Barrick Announces Election of Directors • GlobeNewswire Inc. • 04/30/2024 08:15:55 PM
- Barrick On Track to Achieve 2024 Targets • GlobeNewswire Inc. • 04/16/2024 11:00:00 AM
- Notice of Release of Barrick’s First Quarter 2024 Results • GlobeNewswire Inc. • 04/09/2024 11:00:00 AM
- Strategy-Driven Barrick Builds on Value Foundation • GlobeNewswire Inc. • 03/28/2024 09:20:38 PM
- Barrick Hunts New Gold and Copper Prospects in DRC From Kibali Base • GlobeNewswire Inc. • 03/20/2024 02:00:00 PM
- Barrick Opens Academy at Closed Buzwagi Mine • GlobeNewswire Inc. • 03/18/2024 08:00:00 AM
- Barrick to Grow Production and Value on Global Asset Foundation • GlobeNewswire Inc. • 03/15/2024 11:53:01 AM
- Loulo-Gounkoto Delivers Another Value-Creating Performance • GlobeNewswire Inc. • 03/10/2024 10:00:00 AM
VHAI - Vocodia Partners with Leading Political Super PACs to Revolutionize Fundraising Efforts • VHAI • Sep 19, 2024 11:48 AM
Dear Cashmere Group Holding Co. AKA Swifty Global Signs Binding Letter of Intent to be Acquired by Signing Day Sports • DRCR • Sep 19, 2024 10:26 AM
HealthLynked Launches Virtual Urgent Care Through Partnership with Lyric Health. • HLYK • Sep 19, 2024 8:00 AM
Element79 Gold Corp. Appoints Kevin Arias as Advisor to the Board of Directors, Strengthening Strategic Leadership • ELMGF • Sep 18, 2024 10:29 AM
Mawson Finland Limited Further Expands the Known Mineralized Zones at Rajapalot: Palokas step-out drills 7 metres @ 9.1 g/t gold & 706 ppm cobalt • MFL • Sep 17, 2024 9:02 AM
PickleJar Announces Integration With OptCulture to Deliver Holistic Fan Experiences at Venue Point of Sale • PKLE • Sep 17, 2024 8:00 AM

